Market Snapshot
On 2026-03-24, Cardano (ADA) trades around $0.261–$0.262 with a short-term bias toward consolidation in a low-volatility regime. The instrument sits between key supports and resistance, with a near-term tilt toward downside probability but a neutral RSI profile. Market breadth remains favorable, while BTC/ETH flow context adds macro backdrop without being a primary ADA signal.
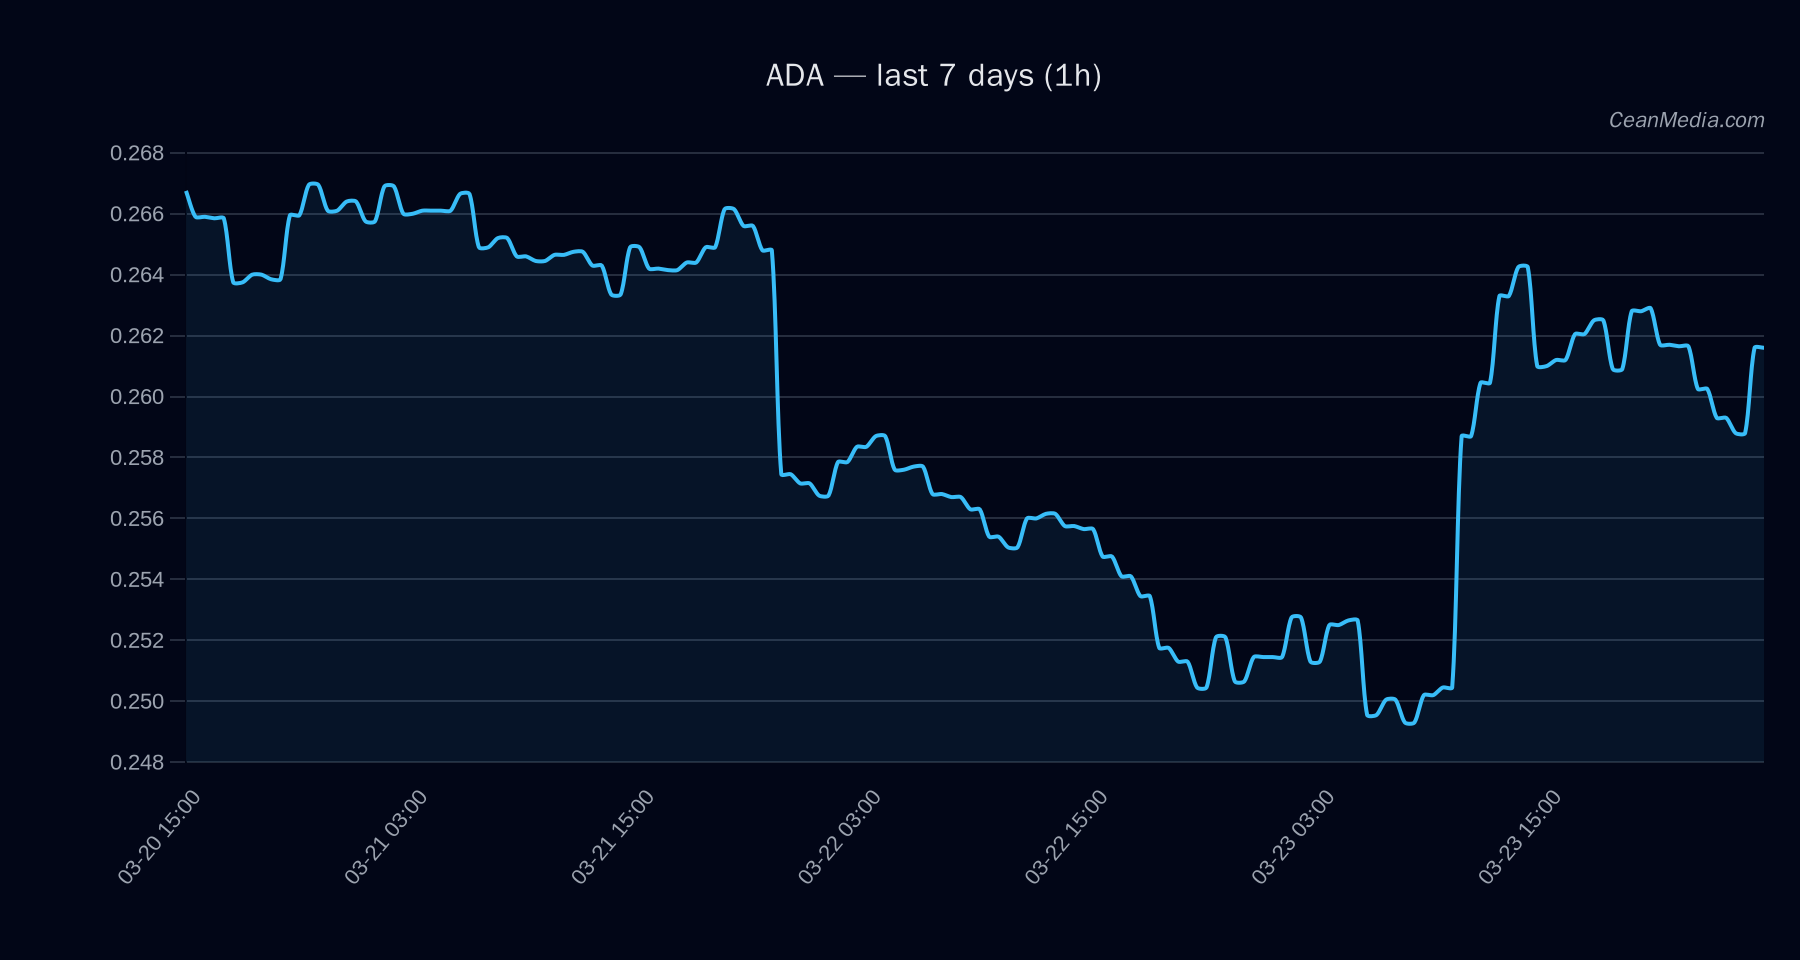
Technical Analysis: ADA
Current price: 0.2605–0.2616
Bias / Forecast: Down (49%) with sideways tendencies in the near term
Key levels:
- Support (Major): 0.255
- Support (Near): 0.255
- Resistance (Near): 0.265
- Resistance (Major): 0.285
- Band (P20–P80): 0.2459 – 0.2731
Momentum indicators:
- EMA12 > EMA26 (bullish cross context)
- SMA50 < SMA200 (mixed/mildly bearish longer-term signal)
- RSI: 55 (neutral)
- Volatility (σ24h): 0.86% (very low)
- Vol regime: Very low
Breakout/invalidations:
- Upside trigger: Close above 0.265 targets 0.271 – 0.2763
- Downside trigger: Close below 0.255 targets 0.2502 – 0.2451
Trade bias & scenario: With price above near support but below major resistance, the setup favors a cautious stance. A sustained move above 0.265 would shift the bias toward 0.271–0.2763; a break below 0.255 increases the probability of a deeper pull toward the 0.245–0.250 zone.
Drivers
- Return 24h: +0.04%
- EMA slope: +0.0008
- Order-book imbalance (EMA5): 0.07
- BTC 24h return: +0.04%
- BTC vol regime: 1 (low/normal volatility)
- BTC trend strength: 0.91
- Vol regime: Very low
- Other momentum signals: Mixed readings (distance from MA ~0.59%), drawdown 30d ~ -15.45%
Overall, ADA shows a neutral to slightly cautious momentum with a tilt toward short-term downside probability within a defined range, supported by a subdued volatility backdrop.
ETF Flows (BTC/ETH)
ETF flow data is provided for BTC and ETH only and is included as contextual market breadth. The BTC ETF shows a 1-day inflow of +$6.4M, with a 5-day outflow of -$61.6M and 10-day inflow of +$630.6M. ETH ETF data shows a 1-day outflow of -$1.6M, with 5-day inflow of +$24.2M and 10-day inflow of +$167.0M. These flows reflect macro risk-on/off signals in the broader crypto complex but should not be treated as a primary signal for ADA trading decisions. The ADA setup remains driven by its own price action and micro-structure signals.
What to Watch Next
- Watch for a close above 0.265 to validate an upside continuation toward 0.271–0.2763.
- Monitor for a close below 0.255 to anticipate a move toward 0.250–0.245.
- Track BTC ETF flow momentum as a broad-market risk proxy, acknowledging it is contextual rather than a direct ADA signal.
- Observe changes in volatility regime; a shift from very low could precede a more directional move in ADA.
Hashtags: #ADA #Cardano #CryptoMarkets #TechnicalAnalysis #CryptoFlows #ETFFlows #BTC #ETH #MarketSnapshot #PriceAction #RSI #Volatility