Market Snapshot
Date: 2026-03-25 | Primary Asset: BNB
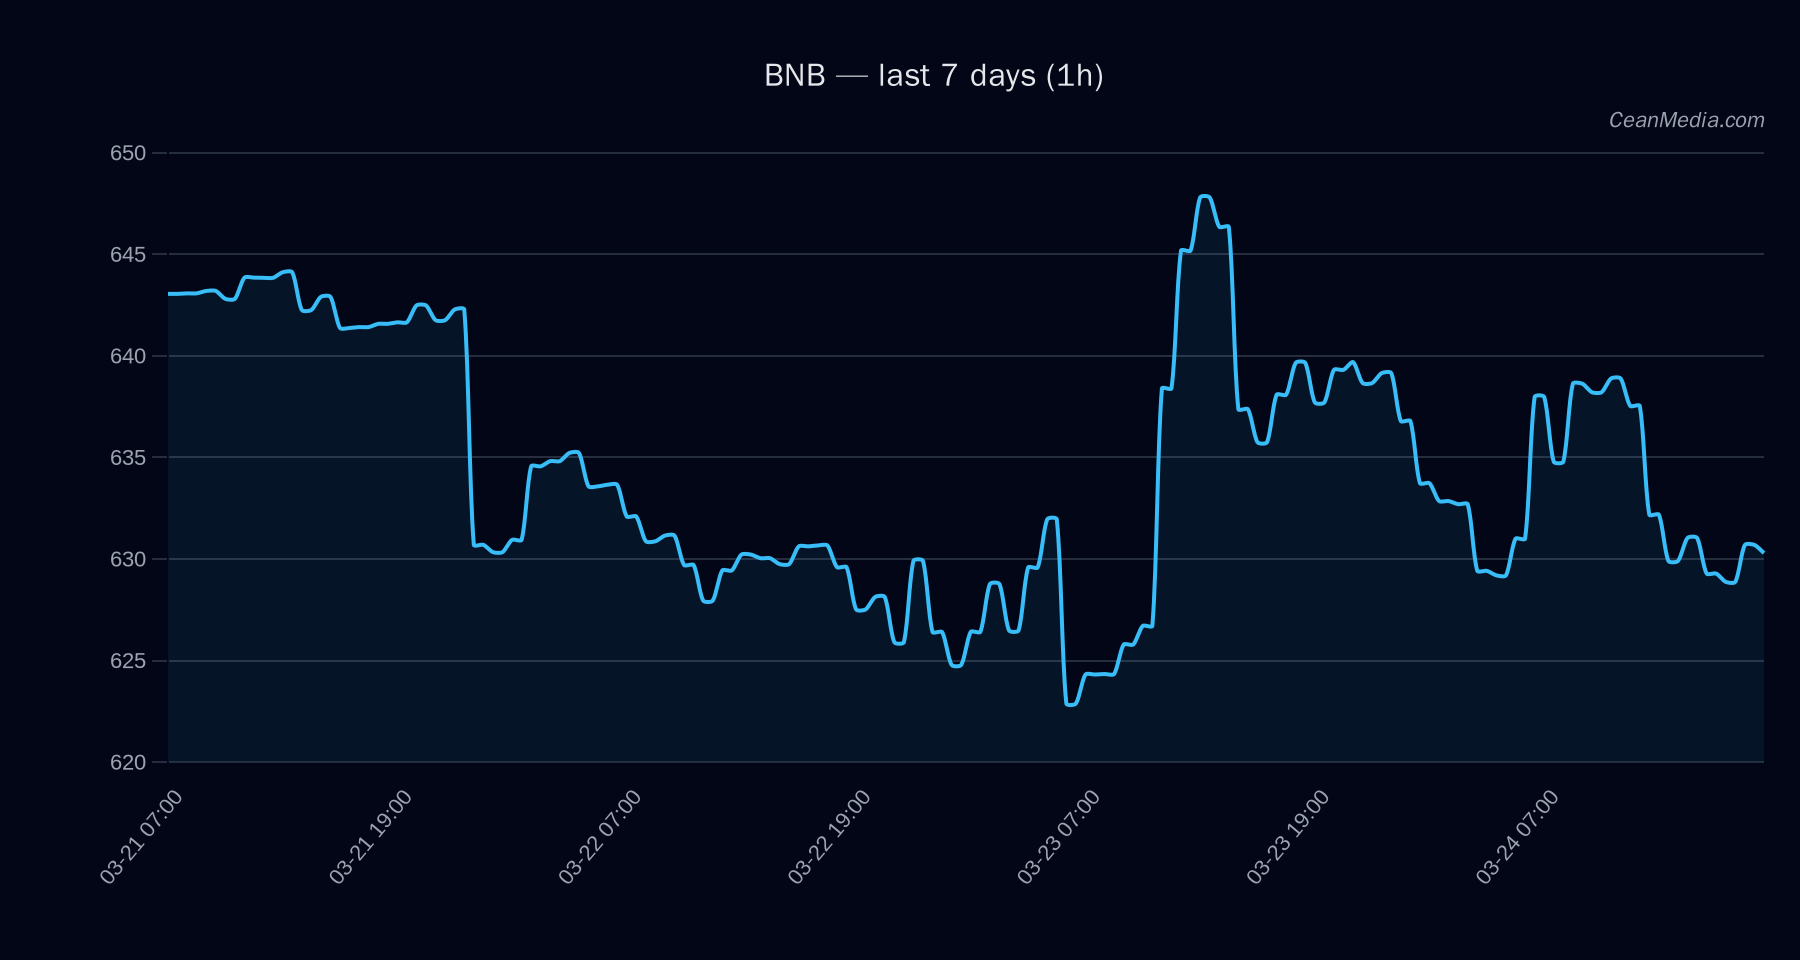
Current price around 630.38 with a short-term bias leaning higher based on the latest TA snapshot. Band estimates place the near-term range roughly between 588 and 632, with major resistance at 664 and major support at 624. Market breadth remains below the 50% threshold, and volatility is described as very low.
Technical Analysis: BNB
Price currently sits between support at 618 (near-term) and resistance at 643 (near-term). Break above 643 signals potential moves toward the 655.85–668.71 region; break below 618 opens downside targets around 605.42–593.06. EMA12 is below EMA26 and SMA50 is below SMA200, indicating bearish trend alignment in the shorter-to-intermediate horizon. RSI at 44 implies neutral momentum rather than overbought/oversold extremes. P50 around 620.51, with a P20–P80 band spanning 588.16 to 631.76. This positioning supports a likelihood of range-bound behavior unless a breakout occurs. An intraday close above 643 would target 655.85–668.71; a close below 618 would expose 605.42–593.06.
Drivers
- Top factors (short-term): RETURN 24H (-0.01), EMA SLOPE (-0.0005), FUNDING Z-SCORE (0.68), BASIS Z-SCORE (0.88), ORDER-BOOK IMBALANCE (EMA5) (0.12).
- BTC correlation and regime: BTC RETURN 24H (-0.02), BTC VOL REGIME (0), BTC TREND STRENGTH (0.88).
- Additional context: Market breadth >50h at 33%, vol regime remains very low, BTC.D around 56.3% with a slight weekly decline, and overall sentiment pulled by external risk-off indicators (F&G: 11, Extreme Fear).
ETF Flows (BTC/ETH)
Contextual backdrop only: ETF flow figures shown are for BTC and ETH and should not be used as a primary signal for BNB. The data indicates:
- BTC ETF: +$6.4M in 1D, -$61.6M in 5D, +$630.6M in 10D
- ETH ETF: -$1.6M in 1D, +$24.2M in 5D, +$167.0M in 10D
Interpretation: The mixed 1D flows in BTC and ETH, combined with longer-dated inflows in BTC, can reflect selective risk-on appetite or hedging activity. However, this ETF data should be viewed as contextual and not a direct signal for BNB’s price action.
What to Watch Next
- Key breakout level: Watch for a close above 643 to validate upside targets toward 655.85–668.71.
- Support degradation: A close below 618 increases probability of testing 605.42–593.06.
- Momentum considerations: RSI remains neutral; monitor if RSI trends toward oversold/overbought as price approaches major levels.
- Monitor ETF flows as contextual risk signals for broader crypto market sentiment, not as a direct driver for BNB.
Hashtags: #BNBAnalysis #TechnicalAnalysis #CryptoMarkets #MarketSnapshot #ETFFlows #BTC #ETH #RiskOn #SupportResistance #PriceAction