Market Snapshot
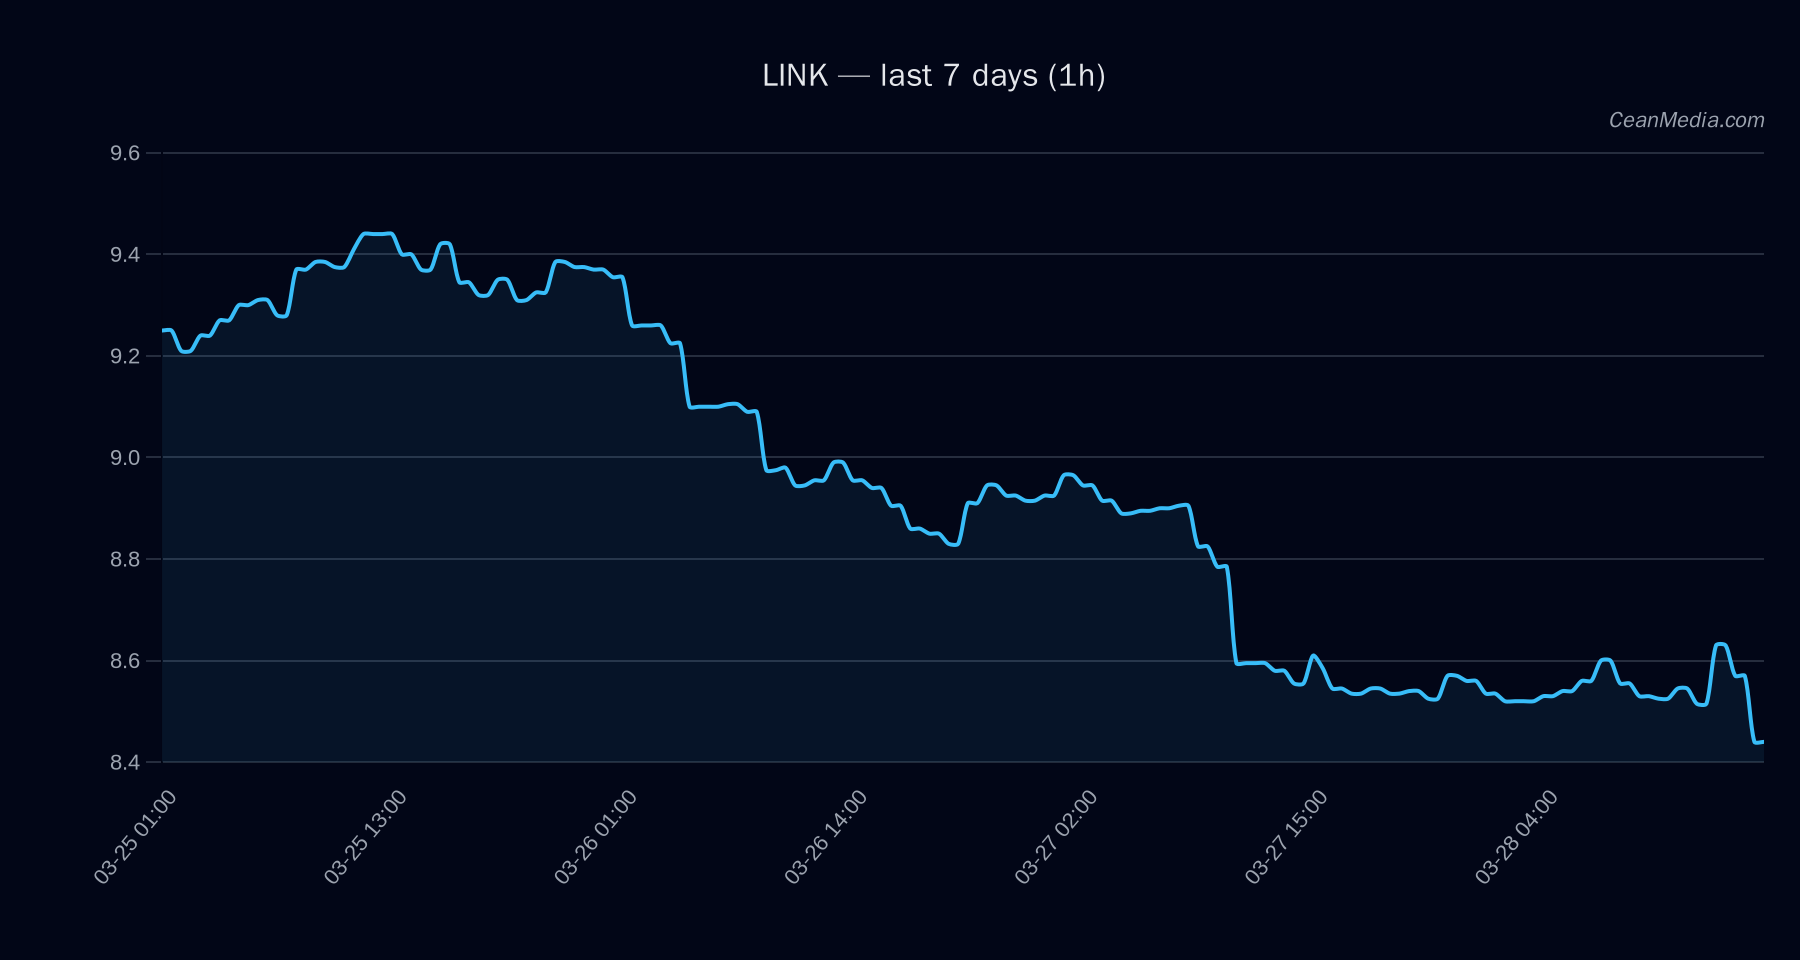
On 2026-03-29, LINK is trading around 8.45 with a short-term forecast biased to the upside (52%). The price sits between a near-term support of 8.28 and resistance of 8.62, with a broader resistance at 9.26 and major support at 8.7. Market context shows a very low volatility regime and a bearish-leaning technical backdrop based on EMA crossovers and RSI positioning.
Key levels to monitor: 8.62 (near resistance) and 8.28 (near support). Breakouts beyond 8.62 suggest potential to 8.79–8.96 in the near term; breakdown below 8.28 points toward 8.12–7.95.
Technical Analysis: LINK
Forecasted to move Up (52%), with a price band from 7.86 to 9.13 (P20–P80), and a current price around 8.45. Upside trigger: 1h close above 8.62 implicates a path to approximately 8.79–8.96. 1h close below 8.28 implicates a path to approximately 8.12–7.95. EMA12 < EMA26, SMA50 < SMA200, RSI 36; volatility regime: Very low. RSI is near neutral rather than oversold or overbought. Major support 8.70; Near support 8.28. Near resistance 8.62; Major resistance 9.26. Trend indicators show mixed signals, with breadth measures indicating soft participation in recent moves. Overall, price action is range-bound with a slight upside tilt on a break of 8.62.
Drivers
- RETURN 24H: -0.02
- EMA SLOPE: -0.0022
- FUNDING Z-SCORE: -0.8
- BASIS Z-SCORE: 0.97
- ORDER-BOOK IMBALANCE (EMA5): -0.1
- BTC RETURN 24H: -0.0005
- BTC VOL REGIME: -1
- BTC TREND STRENGTH: 0.03
ETF Flows (BTC/ETH)
Context: ETF flow data is provided for BTC and ETH only. This information is supplementary and should not be treated as a primary signal for LINK. The current data indicate ongoing net outflows in BTC and ETH ETFs over various horizons, which can influence risk sentiment but does not directly drive LINK pricing.
- BTC ETF: 1D -$24.0M, 5D -$130.4M, 10D +$1.0M
- ETH ETF: 1D -$16.7M, 5D -$35.3M, 10D +$28.5M
What to Watch Next
- Watch for a close above 8.62 to validate the near-term upside to the 8.79–8.96 zone.
- Monitor for a break below 8.28 to confirm a downside path toward 8.12–7.95.
- Observe changes in RSI and EMA crossovers for potential confirmation of regime shift (e.g., RSI breaking above 40–45 or EMA12 crossing EMA26).
- Assess broader market context and BTC/ETH ETF flows for shifts in risk appetite that could impact LINK’s volatility regime.
Hashtags: #LinkNews #CryptoAnalysis #TechnicalAnalysis #ETFFlows #Bitcoin #Ethereum #MarketStructure #Altcoins #PriceAction #TradingSignals #RiskManagement #CryptoMarkets