Market Snapshot
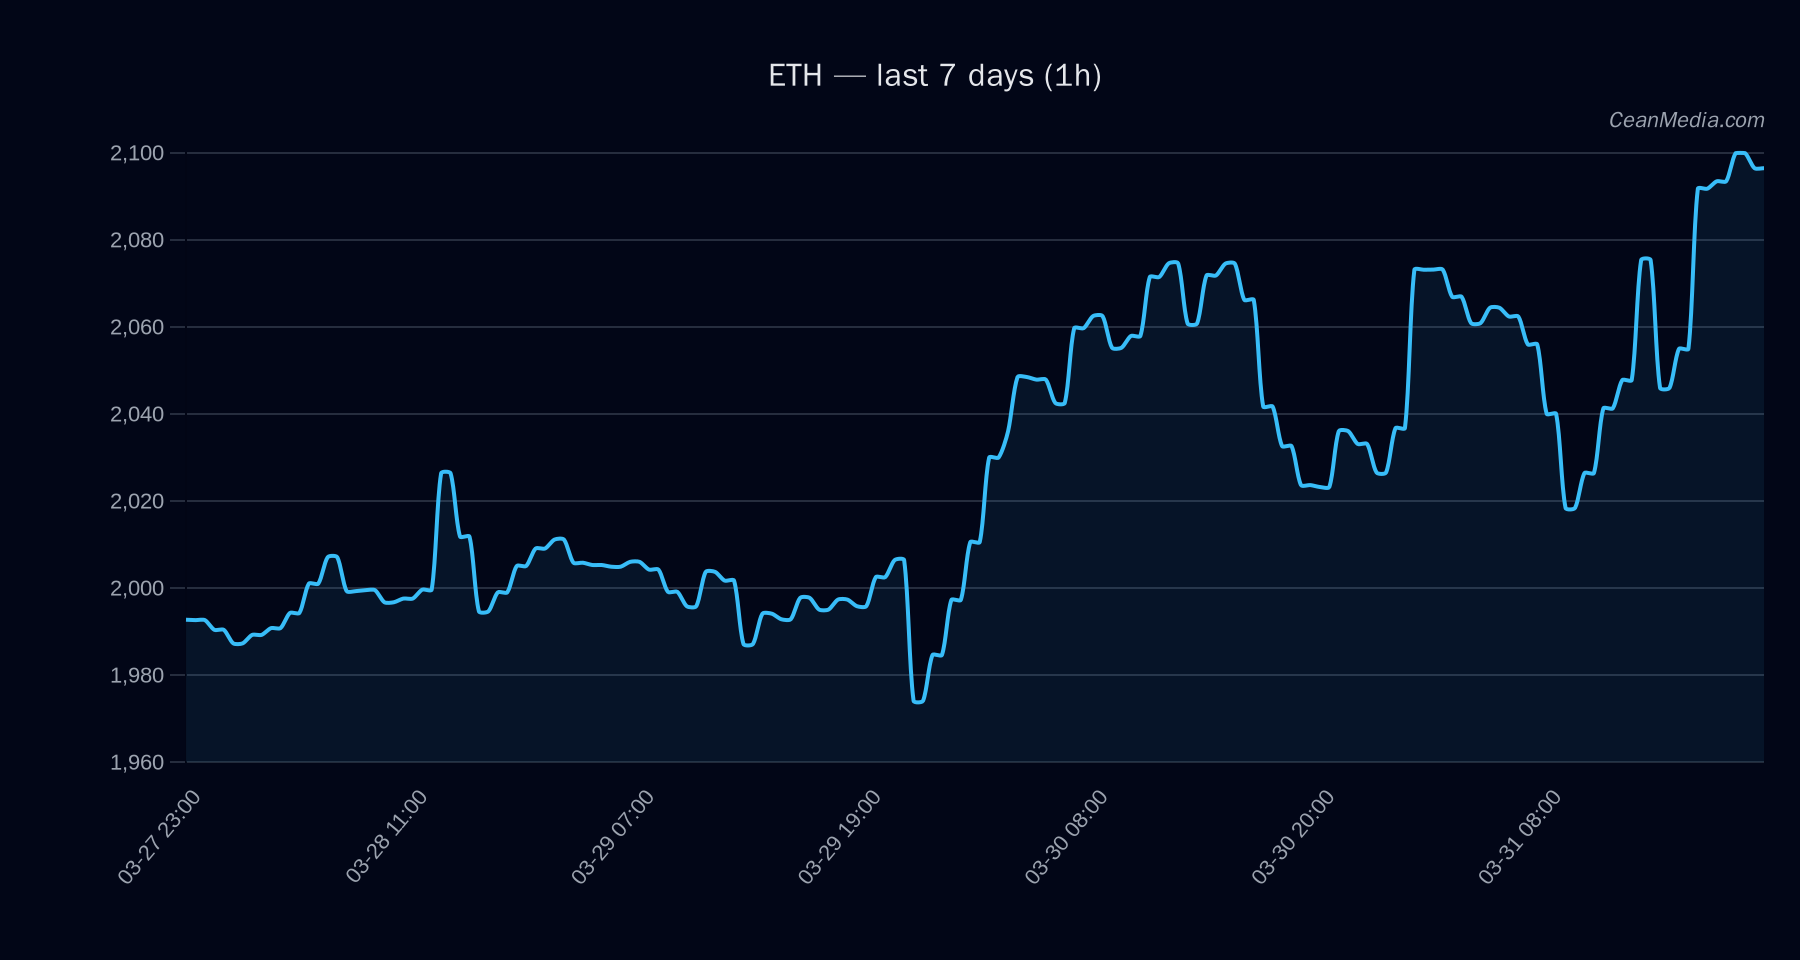
ETH traded around the key mid-zone, with a price near 2,107.08 USD as of the latest read. The instrument sits between a major support at 2,002 and a near-term resistance at 2,150, with an upside scenario above 2,150 targeting 2,192.21–2,235.19 and a downside scenario below 2,064 targeting 2,023.64–1,982.34. The current forecast implies a bias toward upside with a probability around 48% for an upward move in the near term.
Technical Analysis: ETH
Forecast is up (48% probability). Trading in a sideways-leaning regime as EMA12>EMA26 and SMA50 Support 1: 2,064 (major near-term). Support 2: 2,002 (major). Resistance 1: 2,150 (near). Resistance 2: 2,308 (major). P50 fair value at 2,062.76; band (P20–P80) ranges roughly 1,853.91 to 2,188.69. 24H return 0.04%, EMA slope 0.0021, Funding Z-Score 0.27, Basis Z-Score 0.31, Order-book Imbalance (EMA5) 0.1, BTC 24H return 0.02, BTC volatility regime 1. Revisit if price closes decisively below 2,002 or above 2,308 to redefine the near-term bias.
Drivers
Breadth > 50h at 83% suggests broader participation in the move, though ETF flows provide a contextual backdrop rather than a direct ETH signal. BTC relative performance and trend strength contribute to ETH dynamics, with BTC 24H return near 2% and BTC trend strength around 0.66. F&G sentiment indicator shows Extreme Fear historically; current ETF data adds contextual nuance rather than a definitive directional signal for ETH.
ETF Flows (BTC/ETH)
ETF flow data is provided for BTC and ETH strictly as contextual reference. It should not be treated as a primary ETH signal. The most recent figures show:
1D: +$61.9M; 5D: -$276.4M; 10D: -$338.0M 1D: +$4.4M; 5D: -$60.2M; 10D: -$36.0M
Interpretation: Positive BTC ETF flow in the last day may reflect a short-term risk-on tilt, while ETH ETF activity has been modest and mostly negative over the medium horizon. The ETF data should be considered as supplementary context and not the primary driver for ETH trading decisions.
What to Watch Next
- Watch for a sustained close above 2,150 to validate the upside target toward 2,192–2,235.
- Monitor a break below 2,064 as a potential trigger for a move toward 2,023–1,982.
- Keep an eye on BTC performance and broader market signaling, as BTC trend strength and volatility regime can influence ETH momentum in the near term.
- Consider the evolving ETF flow backdrop as contextual risk-on/off signals, without relying on it as a primary ETH signal.
Hashtags: #ETH #Ethereum #CryptoNews #MarketAnalysis #TechnicalAnalysis #ETFFlows #BTC #AltMarket #PriceAction #TradingStrategy #RiskOn #Liquidity