Market Snapshot
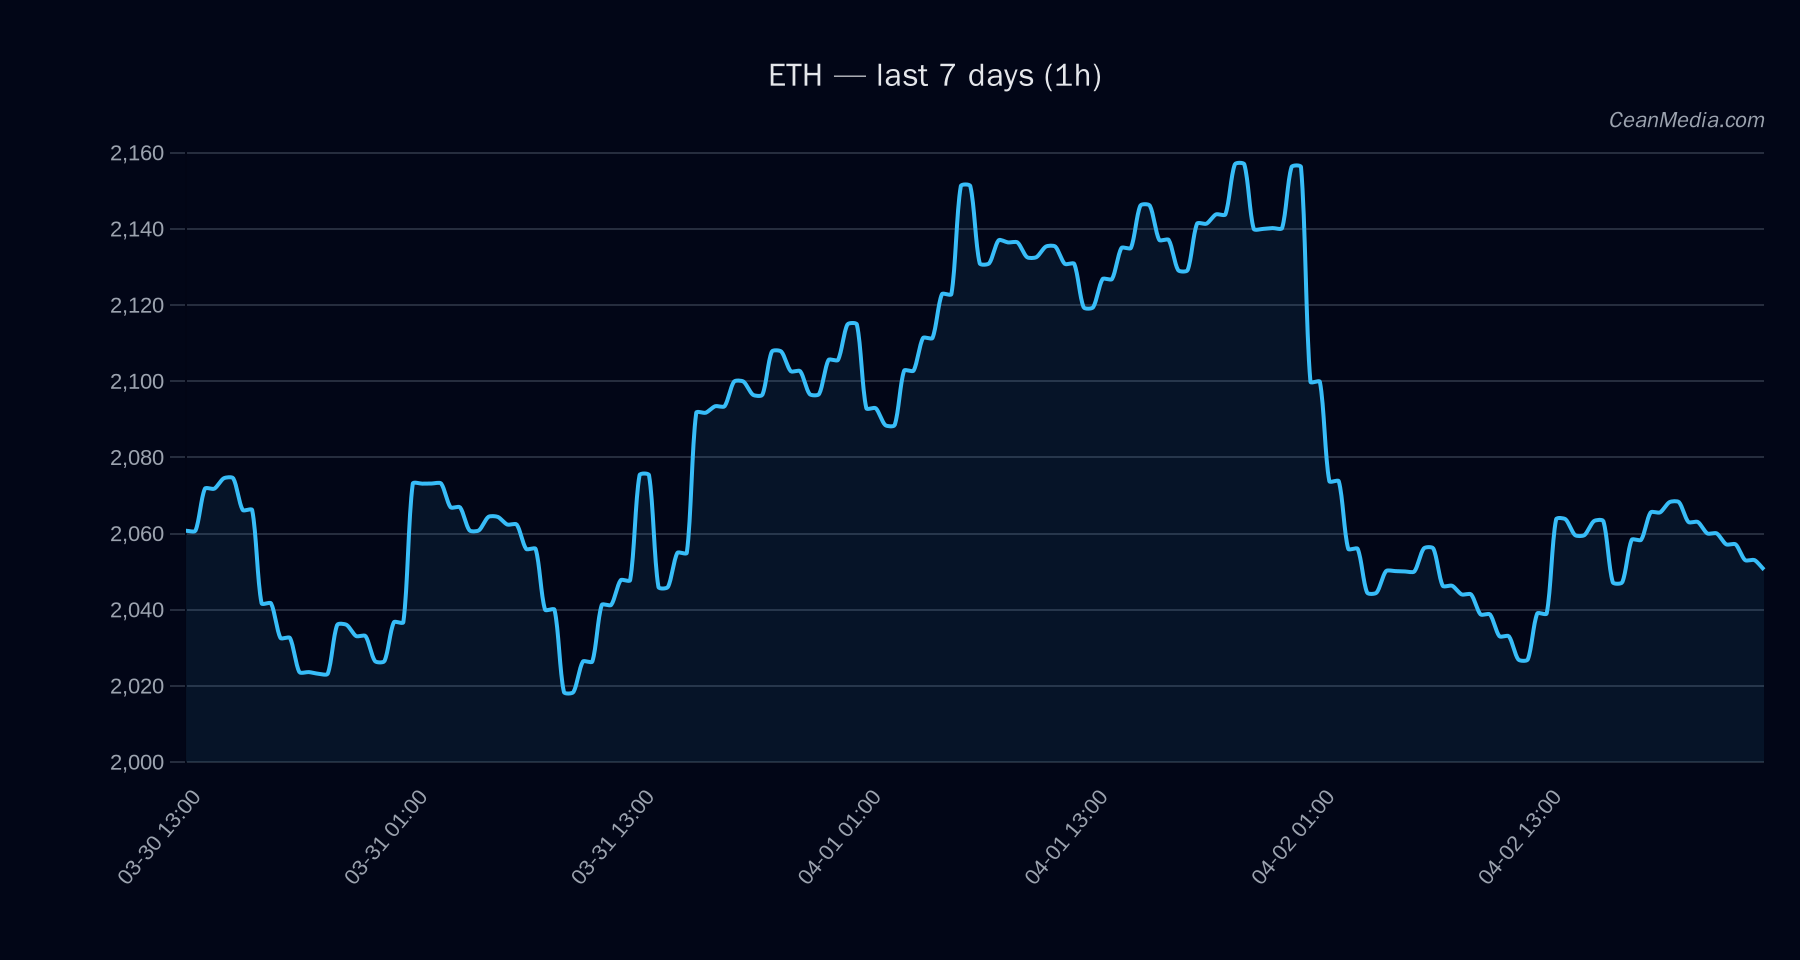
Ethereum (ETH) trades around the major support and resistance band between 2,010 and 2,092, with a current price near 2,051.69. The short-term forecast favors an upside bias at 55% probability, though the broader context shows sideways-to-narrow-range dynamics given low volatility and mixed momentum indicators.
Technical Analysis: ETH
: EMA12 < EMA26; SMA50 > SMA200; RSI 43; 24h volatility (σ24h) 0.50%; Vol regime: Very low : 1,861.01 – 2,168.79 : 1h close > 2,092 targets 2,134.58 – 2,176.43 : 1h close < 2,010 targets 1,970.44 – 1,930.23 : Up (55%), with TA labeled as sideways in the near term : Liquidity Imbalance and EMA12/price dynamics are notable, with several contributing factors from Z-scores and order-book balance.
Drivers
- Top drivers indicate liquidity-driven constraints: LIQ IMB Z-SCORE and EMA12 influence are prominent, weightings show negative contributions to momentum despite value signals.
- Momentum indicators show RSI around neutral (43) with low volatility, suggesting limited immediate directional thrust unless a breakout above resistance occurs.
- BTC-related signals are correlated but not sole drivers; ETH-specific liquidity and order-book dynamics remain a primary local influence.
ETF Flows (BTC/ETH)
ETF flow context is provided for BTC and ETH, illustrating risk-on/off sentiment levels. Note that ETF data is BTC/ETH specific and should be treated as contextual information rather than a primary signal for ETH alone.
- BTC ETF flows: 1D: -$87.2M; 5D: -$262.7M; 10D: -$343.6M (net outflows, suggesting risk-off pressure on BTC over multiple horizons).
- ETH ETF flows: 1D: +$8.9M; 5D: -$43.2M; 10D: -$86.4M (mixed signals, slight near-term inflow but longer-term outflows, indicating nuanced demand dynamics).
What to Watch Next
- Watch for a decisive close above 2,092 to validate the upside trigger toward 2,134–2,176.
- A break below 2,010 would shift the near-term bias toward the 1,970–1,930 range; monitor for potential rapid retest of 2,000.
- Maintain focus on liquidity-related indicators (order-book imbalances) as a source of near-term directional risk, given very low overall volatility.
- Monitor ETF flows for BTC/ETH as contextual risk-on/off signals; use them to gauge broader market sentiment but not as a primary ETH signal.
Hashtags: #ETH #ETHTA #CryptoAnalysis #MarketOutlook #Liquidity #OrderBook #RSI #EMA #ETFFlows #BTC_ETH_Flow #CryptoMarkets
Disclaimer
Note: This article presents technical analysis with ETF flow context. ETF data shown here is limited to BTC and ETH and should be considered contextual information rather than a stand-alone trading signal for ETH.