Market Snapshot
XR P is trading near the mid-point of its short-term range, with a price around 1.31. The latest readings place risk slightly skewed to the downside as the technical setup shows mixed momentum and a low volatility regime. Broad context remains cautious, with BTC and ETH ETF flows indicating recent net outflows on the BTC side and modest inflows on ETH, providing context but not a primary signal for XRP price action.
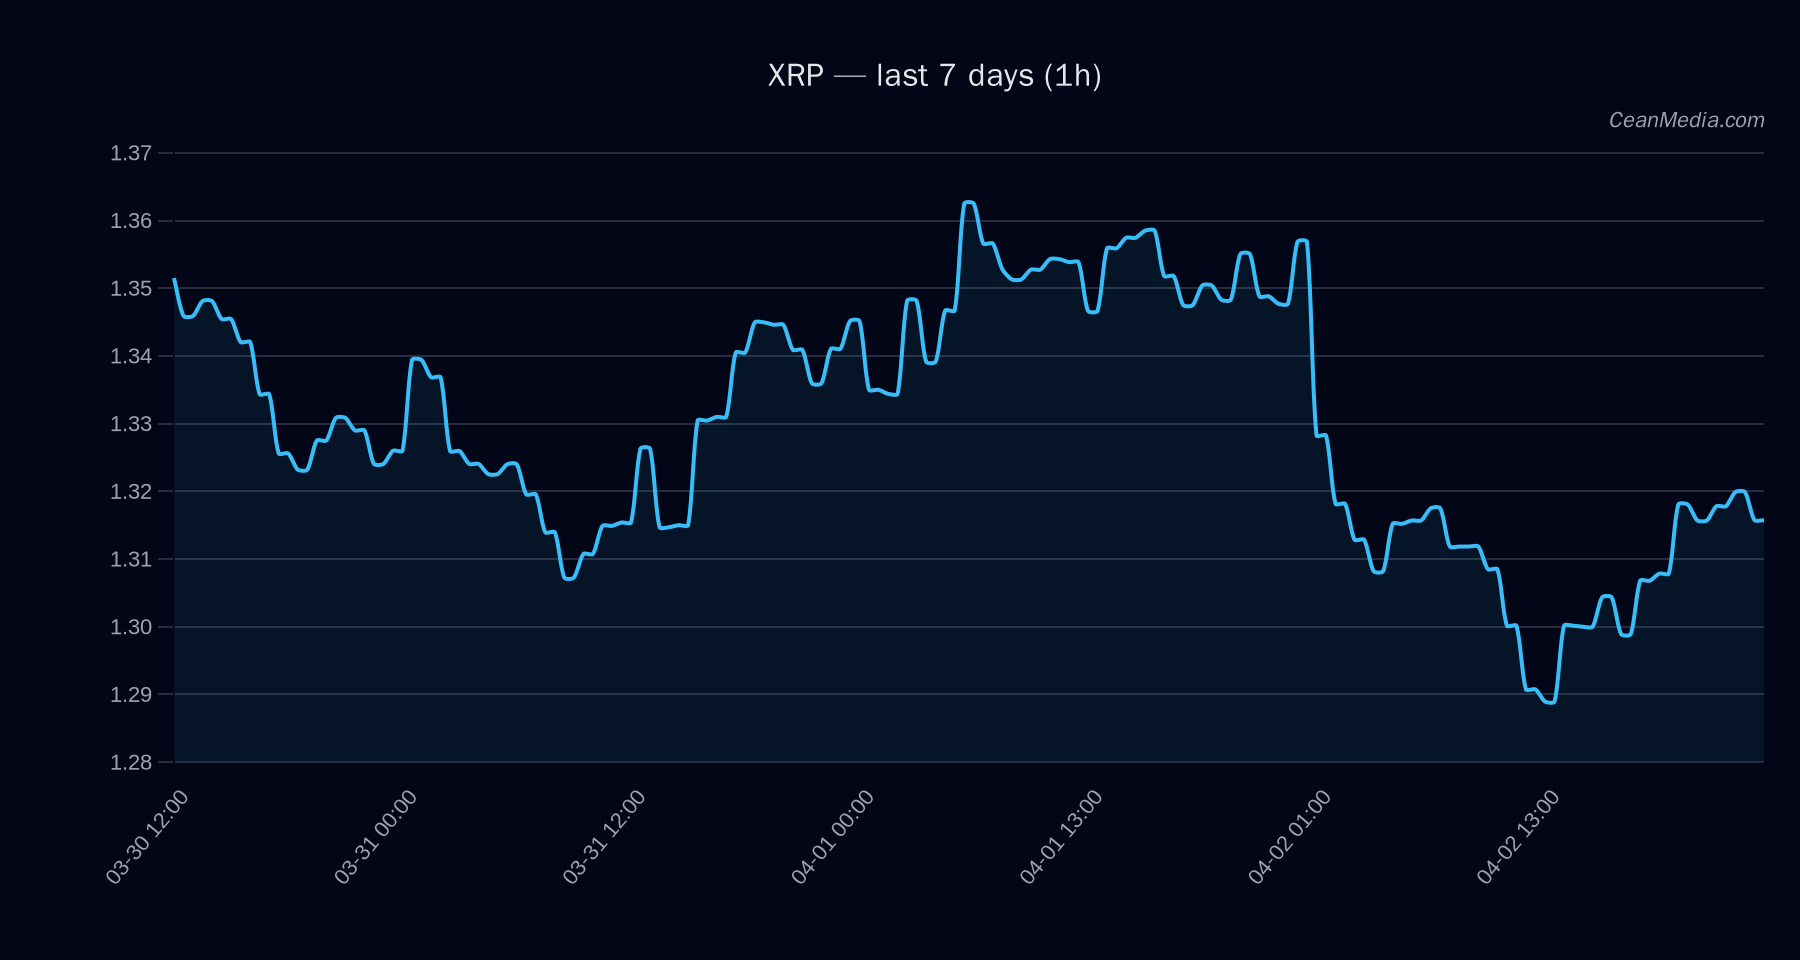
Technical Analysis: XRP
- Current price: 1.314
- Short-term forecast: Sideways (11% probability band stated in the model)
- Probabilities: Up 43%, Side 11%, Down 47%
- Key indicators: EMA12 < EMA26, SMA50 < SMA200, RSI 48, σ24h 0.60%, Very low volatility regime
- Trade range (Band): P20–P80 = 1.2303 – 1.3958
- Support / Resistance: Major support 1.32, Near support 1.28; Major resistance 1.44, Near resistance 1.34
- Break triggers: Upside breakout > 1.34 targets 1.3671 – 1.3939; Downside breakout < 1.28 targets 1.262 – 1.2362
- Overall bias: Bearish texture in the near term given EMA14 alignment and RSI around neutral territory
- Context: Breadth>50h 0%, BTC 72h correlation 0.87; Vol regime: Very low; F&G: 9 (Extreme Fear); BTC.D 56.1%
Drivers
- Top drivers emphasize liquidity dynamics and order-book signals: LIQ TO OI Z-SCORE (contrib 2.27, value -2.37), LS TOP Z-SCORE (contrib -1.63, value 1.25), LS GLOBAL Z-SCORE (0.74, 0.72)
- Other notable drivers: DEPTH Z-SCORE (0.57, -1.92), RV 7D (-0.5, -1.19), DEPTH LOG DELTA 24H (0.46, 0.37)
- Momentum indicators show modest negative 24h return (-0.03), with EMA slope near flat (0.0005) and BTC-related influences slightly negative
- Volatility signals indicate very low regime with little dispersion; trend strength confirms a cautious, sideways environment
ETF Flows (BTC/ETH)
The ETF flow context provided focuses on BTC and ETH rather than XRP. Recent data show BTC ETFs posting net outflows (-$87.2M on 1D, -$262.7M on 5D, -$343.6M on 10D) while ETH ETFs show a modest 1D inflow (+$8.9M) and more pronounced outflows over 5D (-$43.2M) and 10D (-$86.4M). These flows illustrate a broader risk-off or cautious positioning in BTC-denominated products and a mixed sentiment in ETH products. It is important to note that ETF data for BTC/ETH is contextual only and should not be treated as a primary signal for XRP price action.
What to Watch Next
- Watch for a sustained close above 1.34 to validate a potential move toward 1.3671–1.3939.
- Monitor a break below 1.28 for downside probes toward 1.262–1.2362.
- Observe changes in volatility regime; a shift from Very low could precede more defined moves.
- Stay attuned to BTC/ETH ETF flow changes as contextual risk sentiment may influence cross-asset correlations, though XRP remains primarily driven by its own technical setup.
Hashtags: #XRP #CryptoAnalysis #TechnicalAnalysis # ETFFlows #BTC #ETH #MarketSnapshot #TradingStrategy #CryptoNews #PriceAction #Liquidity #RiskManagement