Market Snapshot
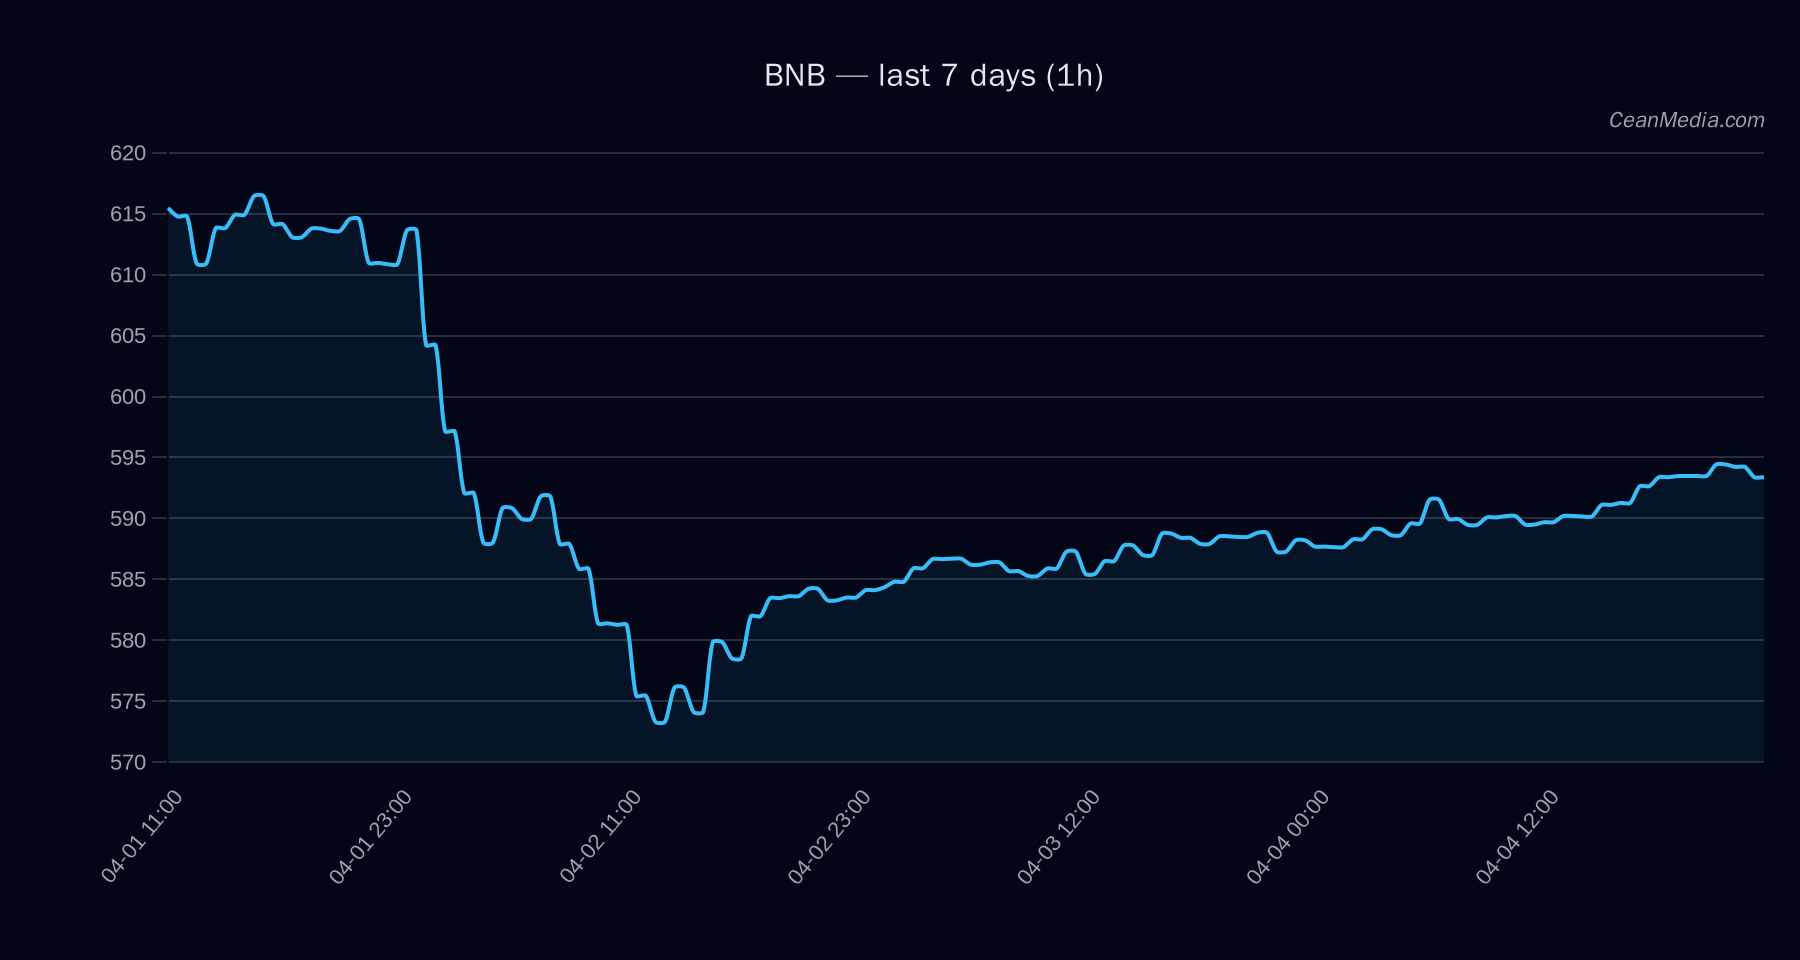
BNB trades around the 593 level with near-term support at 581 and resistance at 605. The price sits within the between the key support and resistance bands, with the immediate upside scenario a break above 605 targeting the 617.18–629.28 range. A break below 581 opens the path toward 569.72–558.09. Market breadth remains favorable with breadth >50h at 83% and overall volatility described as very low.
Technical Analysis: BNB
- Current Price: 593.21
- Short-Term Forecast: Up (46%)
- Bias and Indicators: EMA12>EMA26, SMA50
- RSI: Neutral at 63
- Major/Near-Term Levels: Support 581 (Near 581), Major Support 588; Resistance 605 (Near 605), Major Resistance 622
- Upside Trigger: 1h close > 605 → 617.18–629.28
- Downside Trigger: 1h close < 581 → 569.72–558.09
- Band (P20–P80): 570.39 – 615.23
- Forecast: Up (46%), TA: Sideways leaning with current momentum
- Context: Breadth >50h: 83%; BTC correlation (72h): 0.76; Vol regime: Very low; F&G: 12 (Extreme Fear); BTC.D: 56.2% (+0.2%/7d)
Drivers
- Top drivers indicate a mix of momentum and liquidity factors. Notable contributions include:
- LIQ IMB Z-score: -2.1 (value 8)
- DEPTH USD 10BP LOG1P: -1.52 (value 14.79)
- BTC RV 24H: -1.44 (value -1.5)
- RV 24H: 1.43 (value -1.49)
- SPREAD BP: 0.7 (value 0.93)
- BTC VOL REGIME: 0.37 (value -1.54)
- TBI REL: 0.35 (value 0.75)
ETF Flows (BTC/ETH)
Contextual information only: ETF flows provided are for BTC and ETH and are not a primary signal for BNB trading decisions. Current observations:
- BTC ETF: +$9.0M (1D); -$124.3M (5D); -$282.7M (10D)
- ETH ETF: -$70.3M (1D); -$74.6M (5D); -$135.2M (10D)
The BTC ETF data suggests mixed near-term activity with a modest 1D inflow but an overall negative longer-term trend over 5–10 days. ETH ETF flows show outflows over the short to medium term. This ETF context can influence risk-on/risk-off sentiment broadly but should not be treated as a primary signal for BNB-specific moves.
What to Watch Next
- Monitor a close above 605 for potential acceleration toward 617–629.
- Watch for a break below 581 as a warning of further downside toward 569–558.
- BTC price action and volatility regime could affect cross-asset risk appetite despite BNB’s isolated setup.
- Reassess if liquidity and order-book imbalances shift, given the negative LIQ IMB Z-score signal.
Hashtags: #BNBAnalysis #CryptoMarkets #TechnicalAnalysis #ETFFlows #BTC #ETH #MarketSnapshot #TradingStrategies #Altcoins #CryptoNews #RiskOn #Liquidity