Market Snapshot
BTC trades in a narrow corridor between the near-term support and resistance levels, with very low volatility conditions noted. Fundamental signals are mixed, while on-chain and breadth indicators show mixed momentum. ETF flow data for BTC and ETH provide context but should not be treated as primary BTC signaling tools.
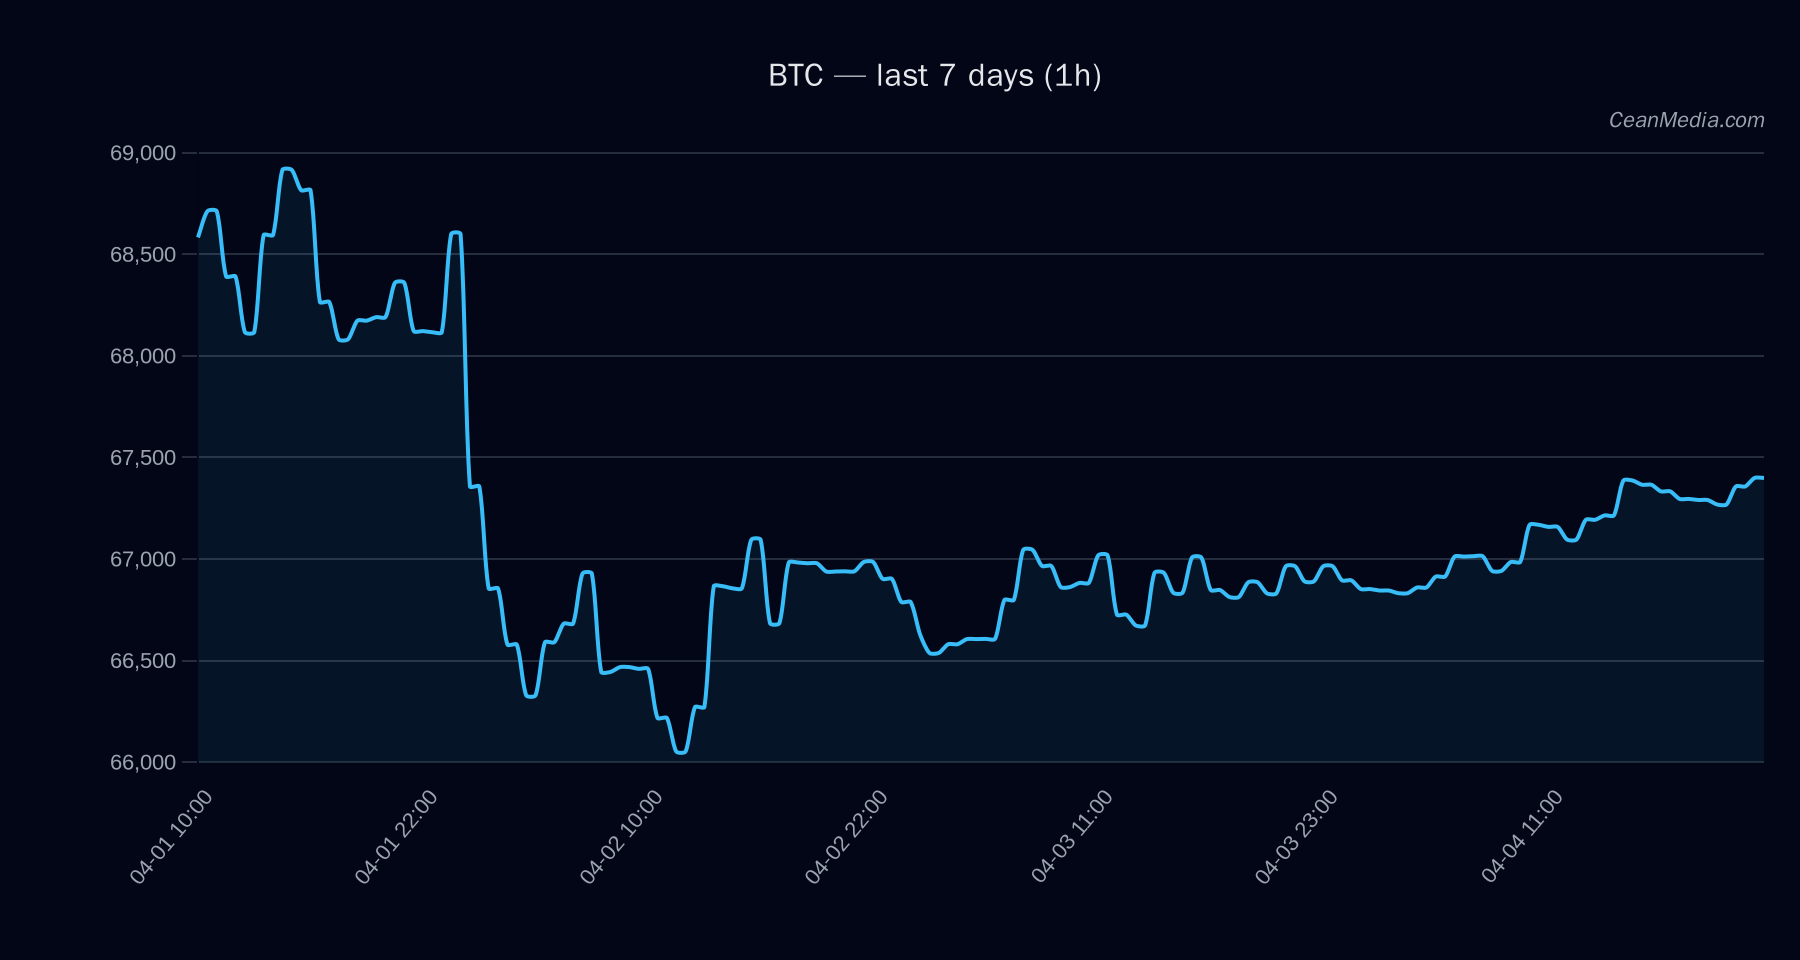
Technical Analysis: BTC
- Current price: 67,300.33
- Bias / Forecast: Sideways (17%), with a higher probability to the upside if the 1h close breaks above 68,650
- Key levels:
- Support (Major): 66,500
- Support (Near): 65,950
- Resistance (Major): 70,525
- Resistance (Near): 68,650
- Target triggers:
- Upside trigger: 1h close > 68,650 → potential move to 70,019.26 – 71,392.19
- Downside trigger: 1h close < 65,950 → potential move to 64,635.24 – 63,316.15
- Indicators: EMA12>EMA26, SMA50
- Top model drivers (high impact): LIQ IMB Z-SCORE, LS GLOBAL Z-SCORE, LS TOP Z-SCORE, TBI REL, DEPTH USD 10BP LOG1P
Drivers
- Key momentum factors: Return 24H 0.76%, EMA slope 0.00036, BTC 24H return 0.76%
- Volatility context: Vol regime: Very low; on-chain depth and liquidity signals show mixed pressure
- Market breadth: Breadth>50h at 83%; BTC.D at 56.2% (slightly rising)
- Sentiment: F&G reading indicates Extreme Fear despite some positive technical signals
ETF Flows (BTC/ETH)
Contextual data: ETF flows are provided only for BTC and ETH. These figures describe investor flow momentum and cannot be treated as primary signals for BTC price movements. The BTC ETF data show a mixed flow pattern, with +$9.0M in 1D, but -$124.3M in 5D and -$282.7M in 10D. ETH ETF data show negative flows across all horizons.
Interpretation
- The short-term BTC ETF flow suggests a modest positive day-to-day pressure, but the longer-horizon frames indicate net outflows, which can reflect reallocations or hedging activity rather than immediate price direction.
- ETH ETF flows are negative across 1D/5D/10D, indicating risk-off or portfolio rebalancing away from ETH in this window.
- Overall ETF context should be treated as supplementary and not a predictive primary signal for BTC price action.
What to Watch Next
- Watch for a daily close above 68,650 to validate upside continuation toward 70,525–71,392.
- Monitor 65,950 for potential breakdown risk and target decay toward 63,316–64,635 if violated.
- Assess changes in breadth and BTC.D when fed with updated order-book and liquidity signals.
- Keep an eye on ETF flow shifts, particularly any reversal in BTC 5D/10D outflows, as a contextual risk-off/outflow indicator.
Hashtags: #BTC #Bitcoin #TechnicalAnalysis #ETFFlows #MarketSnapshot #TradingStrategy #CryptoMarkets #Liquidity #Momentum #Breadth #RiskManagement