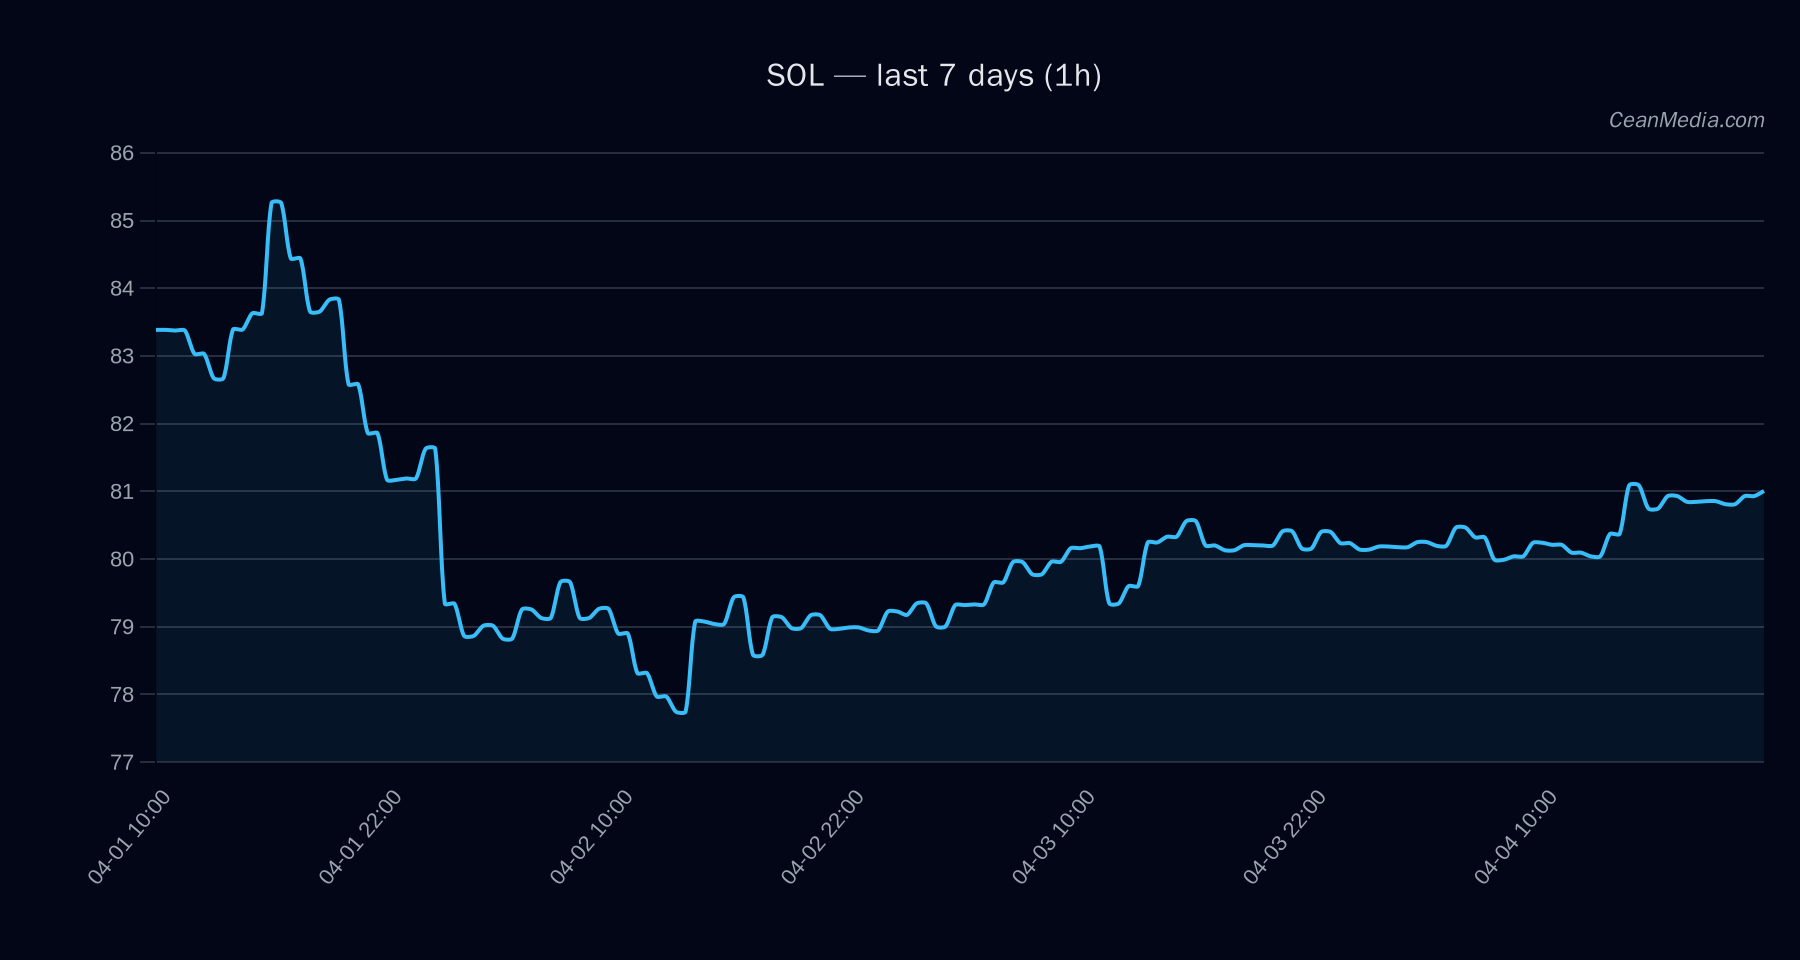
Market Snapshot
Solana (SOL) is trading near notable intraday levels with a defined risk band between 79.4 (support) and 82.6 (resistance). The broader backdrop shows very low volatility regimes and a favorable short-term bias on the current framework, though upside/ downside probabilities are balanced at approximately 50%/42% respectively for the next move.
Technical Analysis: SOL
Key levels
- Support — Major: 80.1; Near: 79.4
- Resistance — Major: 84.9; Near: 82.6
- Nominal price: ~81.0 (as of the snapshot)
Bias and triggers
- Overall bias: Up (50% probability), with a Sideways ta indication from EMA12>EMA26, SMA50
- Upside trigger: A 1h close above 82.6 targets 84.262–85.9142.
- Downside trigger: A 1h close below 79.4 targets 77.7828–76.1954.
Invalidation considerations
- Break below immediate supports or failure to clear 82.6 may shift near-term balance toward range-bound activity or a pullback toward the 79.4 area.
- Persistent strength above 84.9 would widen the upside range toward 86+ in the near term, contingent on continued momentum.
Notes
- Volatility regime described as Very Low; breadth measures indicate robust participation (Breadth>50h: 100%).
- RSI neutral at 61 supports a balanced momentum view rather than overbought conditions.
Drivers
- Top Drivers (qualitative):
- Depth USD 10BP LOG1P: contribution -1.75; value 15.84
- BTC RV 24H: contribution -0.89; value -1.52
- SPREAD BP: contribution 0.5; value 1.24
- LIQ IMB Z-SCORE: contribution 0.5; value -1.77
- RV 24H: contribution 0.45; value -1.29
- BTC VOL REGIME: contribution 0.43; value -1.54
- TBI REL: contribution 0.36; value 0.8
- DISTANCE FROM MA: contribution -0.3; value 0.43
Momentum and risk signals
- Top momentum indicators (e.g., EMA slope, distance from MA) show modest positive tilt, but overall risk signals remain mixed due to external liquidity and BTC-related dynamics.
- Funding and basis z-scores are near neutral to slightly negative, indicating a cautious stance from funding markets.
ETF Flows (BTC/ETH)
Contextual note: ETF flow data presented below pertains only to BTC and ETH and should be treated as context, not a primary signal for SOL. The data reflects risk-on/off sentiment driven by institutional allocations in BTC/ETH ETFs rather than SOL-specific orchestration.
- BTC ETF: 1D +$9.0M; 5D -$124.3M; 10D -$282.7M
- ETH ETF: 1D -$70.3M; 5D -$74.6M; 10D -$135.2M
Interpretation: The BTC/ETH ETF flow data shows mixed to negative flows over longer horizons, which may imply cautious risk-off sentiment in broader crypto markets. Short-run inflows in BTC (1D) contrast with consistent outflows across longer windows, suggesting participants are rebalancing rather than issuing broad bullish commitments. This ETF activity should be considered as a contextual backdrop rather than a SOL-specific driver.
What to Watch Next
- Watch for a close above 82.6 to validate the upside path toward 84.9–85.9 in the near term.
- A break below 79.4 would tilt sentiment toward 77.78–76.20 in the short run.
- Monitor BTC/ETH ETF flows as a contextual risk-on/off signal; sustained weakness in BTC could accompany SOL consolidation despite local bullish signals.
- RSI staying near 61 keeps room for ongoing movement without immediate overbought pressure; watch for any acceleration in volatility if price breaks key levels.
Hashtags: #Solana #SOLTech #CryptoAnalysis #TechnicalAnalysis #ETFFlows #BTC #ETH #MarketNews #CryptoStrategy #SolBullish #RiskManagement #MarketWatch