Market Snapshot
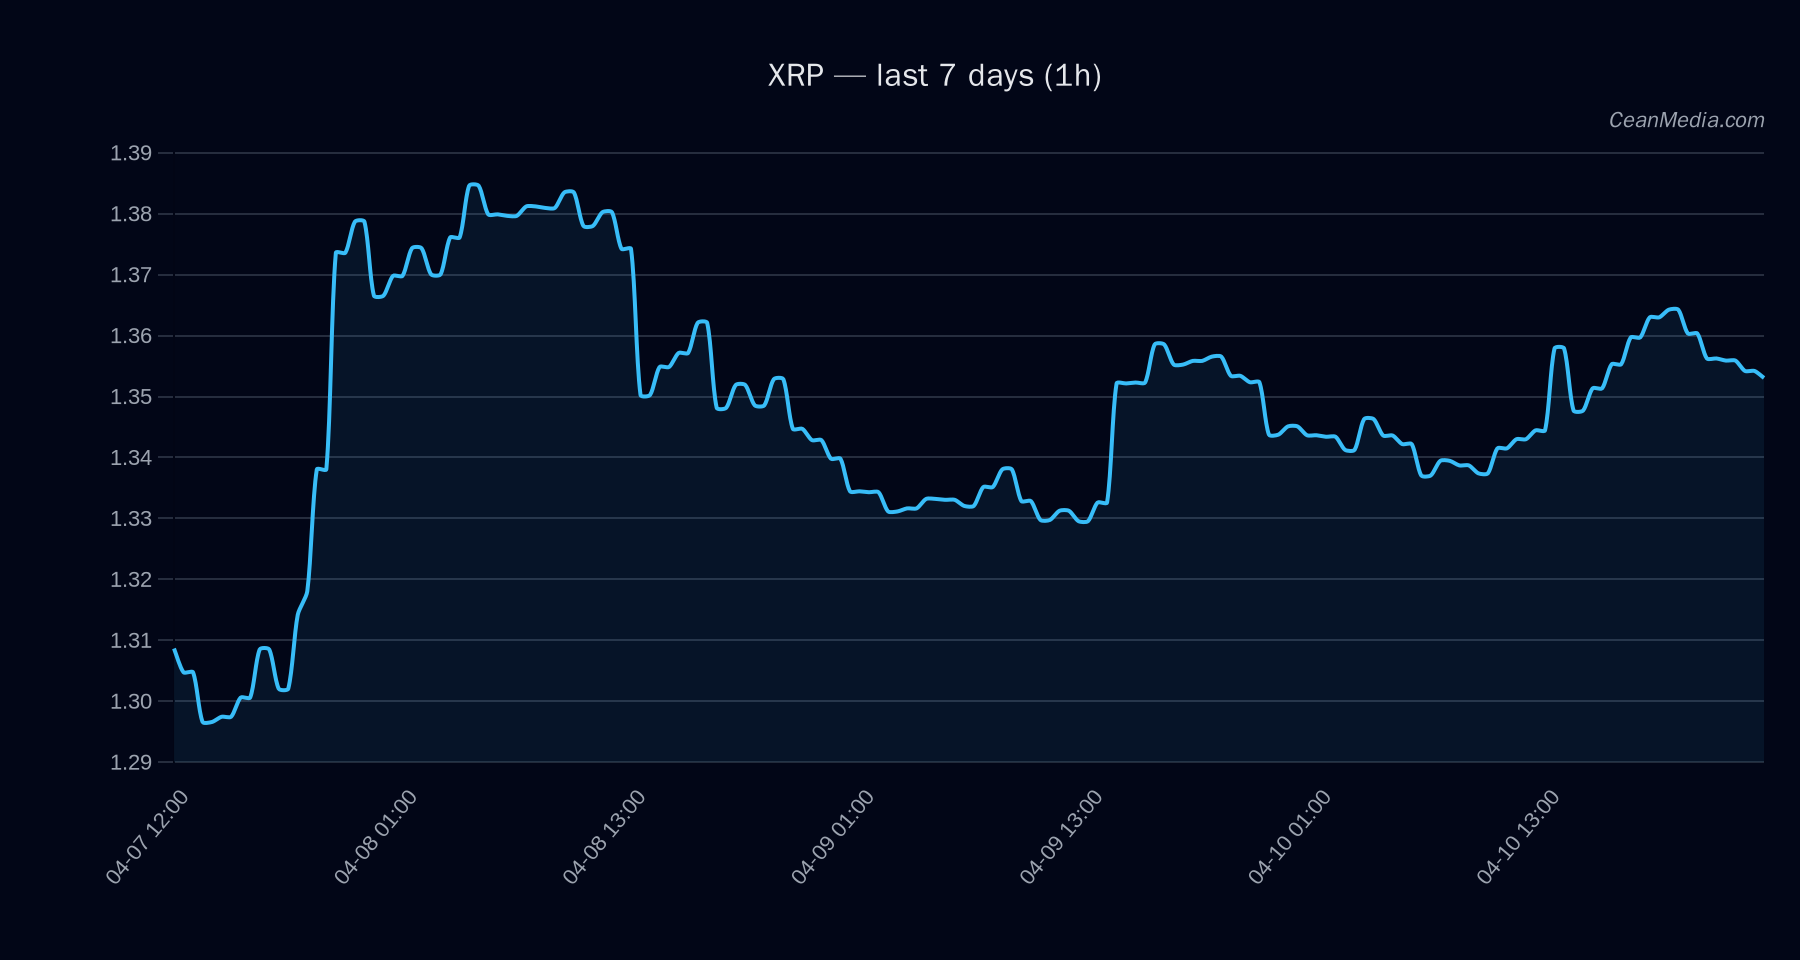
On 2026-04-11, XRP is trading around 1.3554 with a short-term forecast tilted to the downside (52%). The current band sits between support at 1.32 and resistance at 1.38, with a P20–P80 range of 1.3329 to 1.4058. Market breadth remains positive in the 50-hour window, while overall volatility is described as very low. The BTC market context shows a supportive 72-hour correlation (ρ ≈ 0.80) and a positive BTC dominance trend, which can influence altcoin liquidity and risk appetite.
Technical Analysis: XRP
Down (52%), with bullish TA signals overall (EMA12>EMA26, SMA50>SMA200, RSI 55). Volatility regime: Very low; RSI is neutral at 55. - Support: Major 1.32; Near 1.32
- Resistance: Major 1.38; Near 1.38
- Implied breakout targets: If price closes > 1.38, potential move to 1.4102–1.4378
- Invalidation: If price closes < 1.32, potential move to 1.3017–1.2752
Price around 1.3554 with the P50 forecast at 1.3481 and a Band (P20–P80) of 1.3329–1.4058. RSI 55; EMA12>EMA26; SMA50>SMA200; vol regime: very low. - SPREAD BP: negative contribution (-1.54) with value 1,250.81
- EMA Slope (EMA10): slightly positive signal (0.76)
- BREAKOUT 7D: small positive signal (0.23)
- RV 7D: negative contribution (-0.23)
- DRAWDOWN 30D: negative impact (-0.16)
- FUNDING Z-SCORE: positive (0.16)
- BTC RV 24H: positive (0.15)
- ORDER-BOOK IMBALANCE (EMA5): negative (-0.14)
Drivers
Return 24H, EMA slope, Funding Z-score, Basis Z-score, Order-book imbalance, BTC return 24H. Broadly mixed signals with a bullish TA tilt but a forecast that favors a near-term pullback. Volatility is labeled as very low, suggesting ranges may persist unless a breakout occurs.
ETF Flows (BTC/ETH)
The ETF flow data provided is limited to BTC and ETH. BTC ETFs show positive net inflows over 1D, 5D, and 10D horizons (+$35.5M, +$269.1M, +$172.1M respectively), indicating a risk-on tilt and increased BTC demand. ETH ETFs show a net negative flow over 1D, 5D, and 10D horizons (−$8.1M, −$27.2M, −$55.5M respectively), suggesting selective appetite or hedging demand in ETH placements.
Note: ETF data is contextual and should not be treated as a primary signal for XRP. It provides market-wide risk sentiment and capital allocation backdrop that can influence altcoin flow indirectly through liquidity and risk-on/off dynamics.
What to Watch Next
- Watch for a daily close above 1.38 to validate the upside target of 1.4102–1.4378.
- Close below 1.32 would invalidate the current setup and open 1.3017–1.2752 on the downside.
- Monitor BTC flow and overall market risk sentiment, as BTC strength/supports may correlate with XRP performance in the near term.
- Keep an eye on volume regime and volatility shifts, which could precede a breakout or breakdown from the current range.
Hashtags: #XRP #CryptoNews #TechnicalAnalysis #MarketSnapshot #ETFFlows #BTC #ETH #Altcoins #PriceAction #TradingStrategy #CryptoMarkets