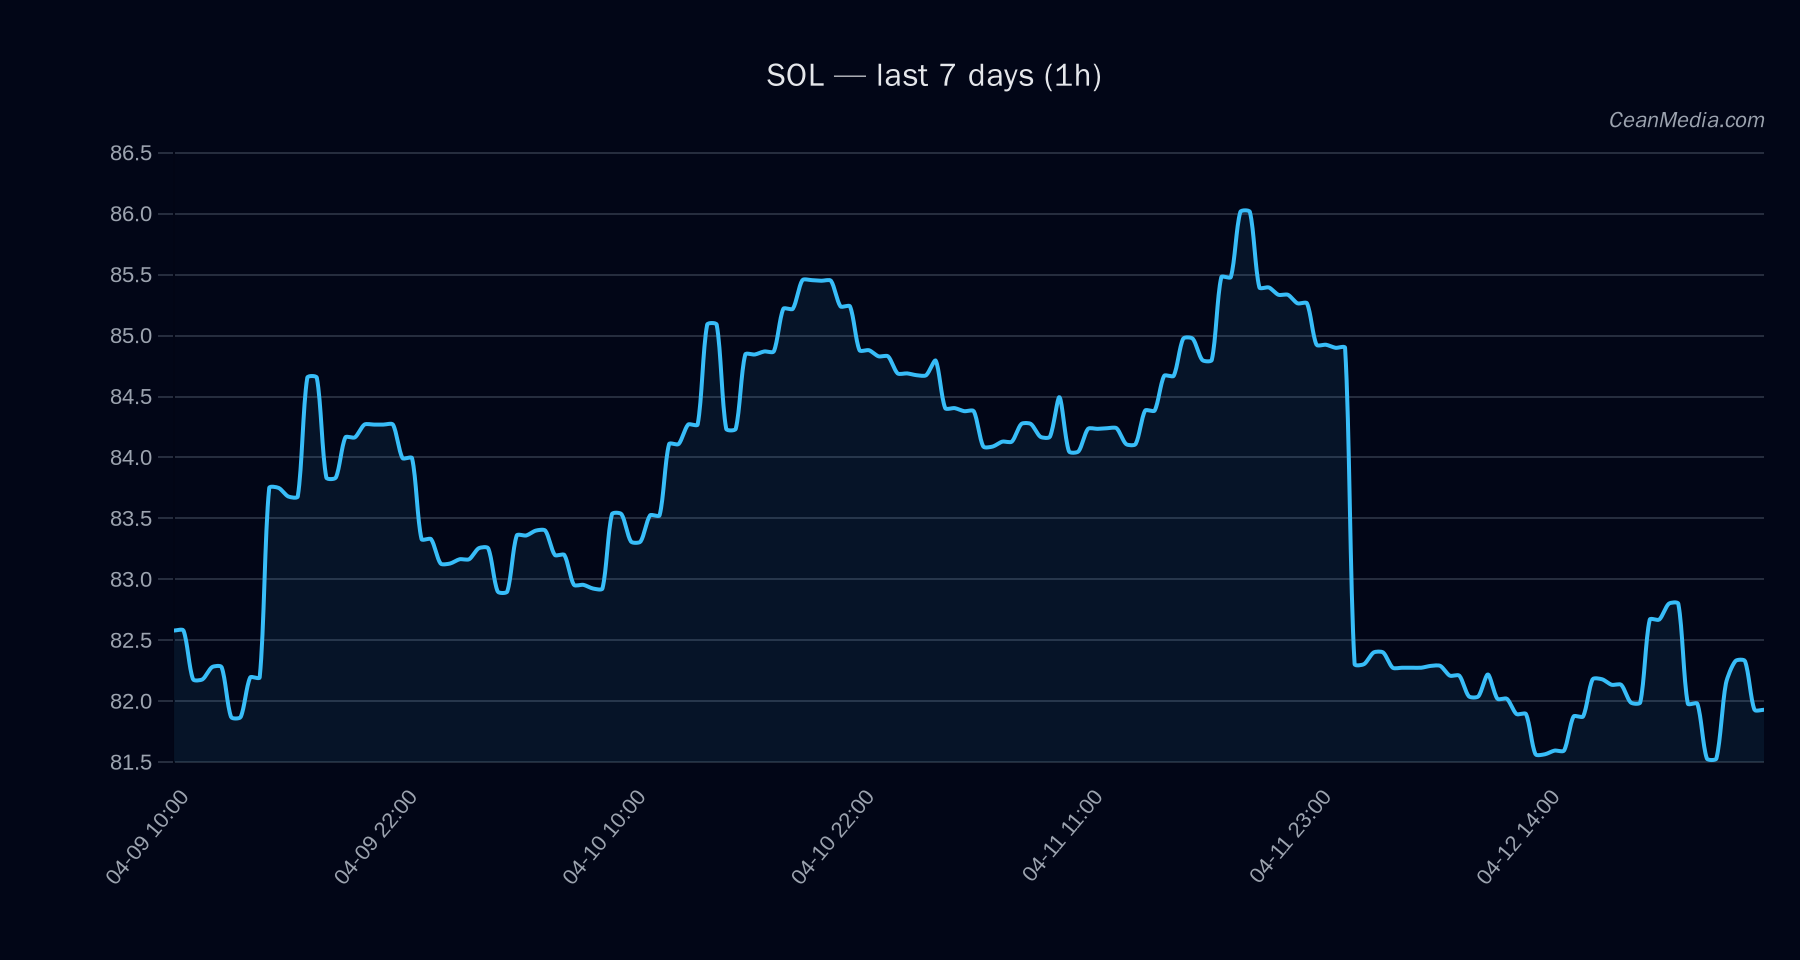
Market Snapshot
Solana (SOL) is trading around the 80–84 range with a short-term forecast leaning up at 50% probability. Current price reported as 81.86, with a price band (P20–P80) of 75.73 to 93.14. Major support sits near 79.5 and near-term support at 80.2, while major resistance is at 84.7 and near-term resistance at 83.5. The context shows very low volatility and a sideways price action bias, with RSI at 42.
Context metrics indicate breadth >50h is 0%, BTC dominance around 56.9%, and funding/fundamental indicators showing mixed signals. The 24h implied volatility (σ24h) is 0.72%, consistent with a quiet market regime.
Technical Analysis: SOL
SOL sits between support at 80.2 and resistance at 83.5. A breakout above 83.5 targets a path to 85.17–86.84. A break below 80.2 opens 78.62–77.01.
Drivers
SPREAD BP, LS GLOBAL DELTA 24H, LS TOP DELTA 24H, ORDER-BOOK IMBALANCE (EMA5) and distance from MA are among the notable factors. Vol regime is very low; RSI in neutral territory (42). The trend indicators show mixed signals with a generally cautious posture in the near term. 24h return marginally negative, with small negative contributions from EMA slope and BTC 24h return; funding and basis z-scores present mixed influence.
ETF Flows (BTC/ETH)
The ETF flow data provided is limited to BTC and ETH only and is intended as contextual market sentiment rather than a primary SOL signal. BTC ETF flows show positive directional movement over 1D, 5D, and 10D horizons, while ETH ETF flows are positive on 1D but weaker over longer horizons. This suggests a risk-on backdrop for blue-chip crypto assets, but SOL should be interpreted within its own technical and fundamental framework rather than as a direct proxy for SOL due to the lack of SOL-specific ETF data in this report.
What to Watch Next
- Monitor price action around 83.5 to validate the upside breakout; consider 85.17–86.84 as potential targets if momentum increases.
- Watch for a break below 80.2 to confirm near-term downside risk toward 78.62–77.01.
- Keep an eye on volatility regime shifts; a move from very low to higher σ24h could precede a more defined directional move.
- Incorporate BTC/ETH ETF flow context as a broader market backdrop, but maintain emphasis on SOL-specific TA and on-chain signals for entry/exit decisions.
Hashtags: #solana #sol #cryptotrading #marketanalysis #technicalanalysis #etfflows #btc #eth #riskon #liquidity #volatility #crypto
Note: ETF data is provided for BTC and ETH only and serves as contextual context, not a primary SOL signal.