Market Snapshot
On 2026-04-16, DOGE traded around 0.0952 with a short-term forecast bias to the downside. Market context shows very low volatility and a bearish tilt in the near term, amid a positive breadth backdrop and mixed momentum signals. BTC/ETH ETF flows are positive across all tracked horizons, providing macro risk-on signals that may influence broad sentiment, though ETF data is not a primary signal for DOGE.
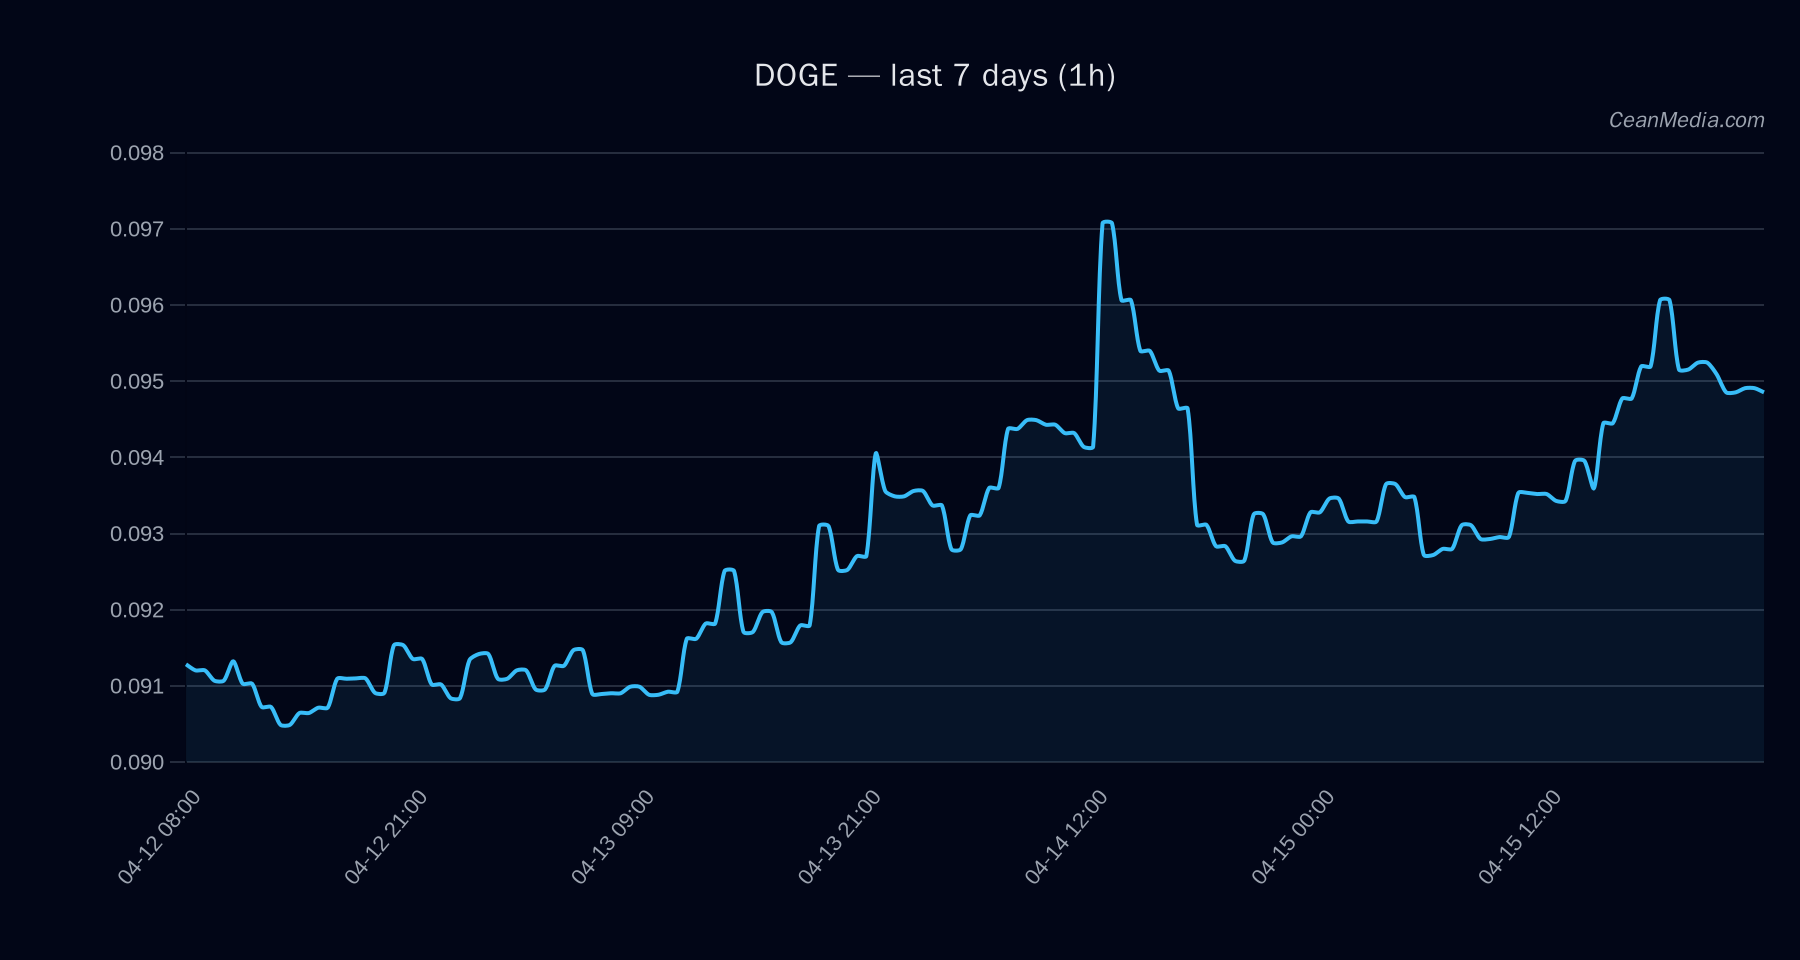
Technical Analysis: DOGE
Price around 0.095; major support at 0.09, near-term support around 0.093; near-term resistance at 0.097 and major resistance at 0.094. Forecast is down (74% probability). TA signals show EMA12 > EMA26 (bullish early signal), SMA50 > SMA200 (bullish longer-term) and RSI at 60. Volatility regime is very low (σ24h 0.46%). Overall, the headline forecast leans bearish, but internal indicators show mixed bullish underpinnings. Break above 0.097 could target 0.099–0.101; break below 0.093 could target 0.0914–0.0896. P20–P80 band is 0.0912–0.0959; P50 at 0.0922.
Drivers
- Top drivers influencing DOGE include liquidity-implied measures, EMA slopes, and funding/basis metrics. Specific contributors note EMA12 strong relative position, Z-score dynamics, order-book imbalances, and inter-market momentum signals.
EMA12>EMA26, and depth/funding indicators contribute positively to near-term momentum, while some skew metrics weigh on price pressure. Overall, momentum indicators show a modest tilt toward downside in the immediate horizon. Very low vol regime; breadth > 50h is at 100%, suggesting a broad participation backdrop, but does not override the downside forecast for DOGE.
ETF Flows (BTC/ETH)
Context: ETF flow data is provided for BTC and ETH and can influence risk sentiment, but it is not a primary signal for DOGE. The data shows broad positive flows across 1D, 5D, and 10D horizons for BTC and ETH, signaling a general risk-on environment that may support altcoins indirectly through improved market mood. Investors should treat this as contextual information rather than a DOGE-specific driver.
- BTC ETF — 1D: +$406.5M, 5D: +$216.6M, 10D: +$771.6M
- ETH ETF — 1D: +$51.1M, 5D: +$58.5M, 10D: +$137.3M
What to Watch Next
- Watch for a close above 0.097 to confirm upside exposure toward 0.099–0.101.
- Monitor if price breaks and closes below 0.093 to validate the downside range toward 0.0914–0.0896.
- Track broader market risk-on signals, including BTC/ETH ETF flow momentum and overall market breadth, for potential indirect support to DOGE.
- Keep an eye on volatility regime; a shift from very low to higher volatility could alter short-term dynamics.
Hashtags: #crypto #DOGE #technicalanalysis #ETFlows #BTC #ETH #marketanalysis #riskon #altcoins #cryptomarket #tradingview #investing