Market Snapshot
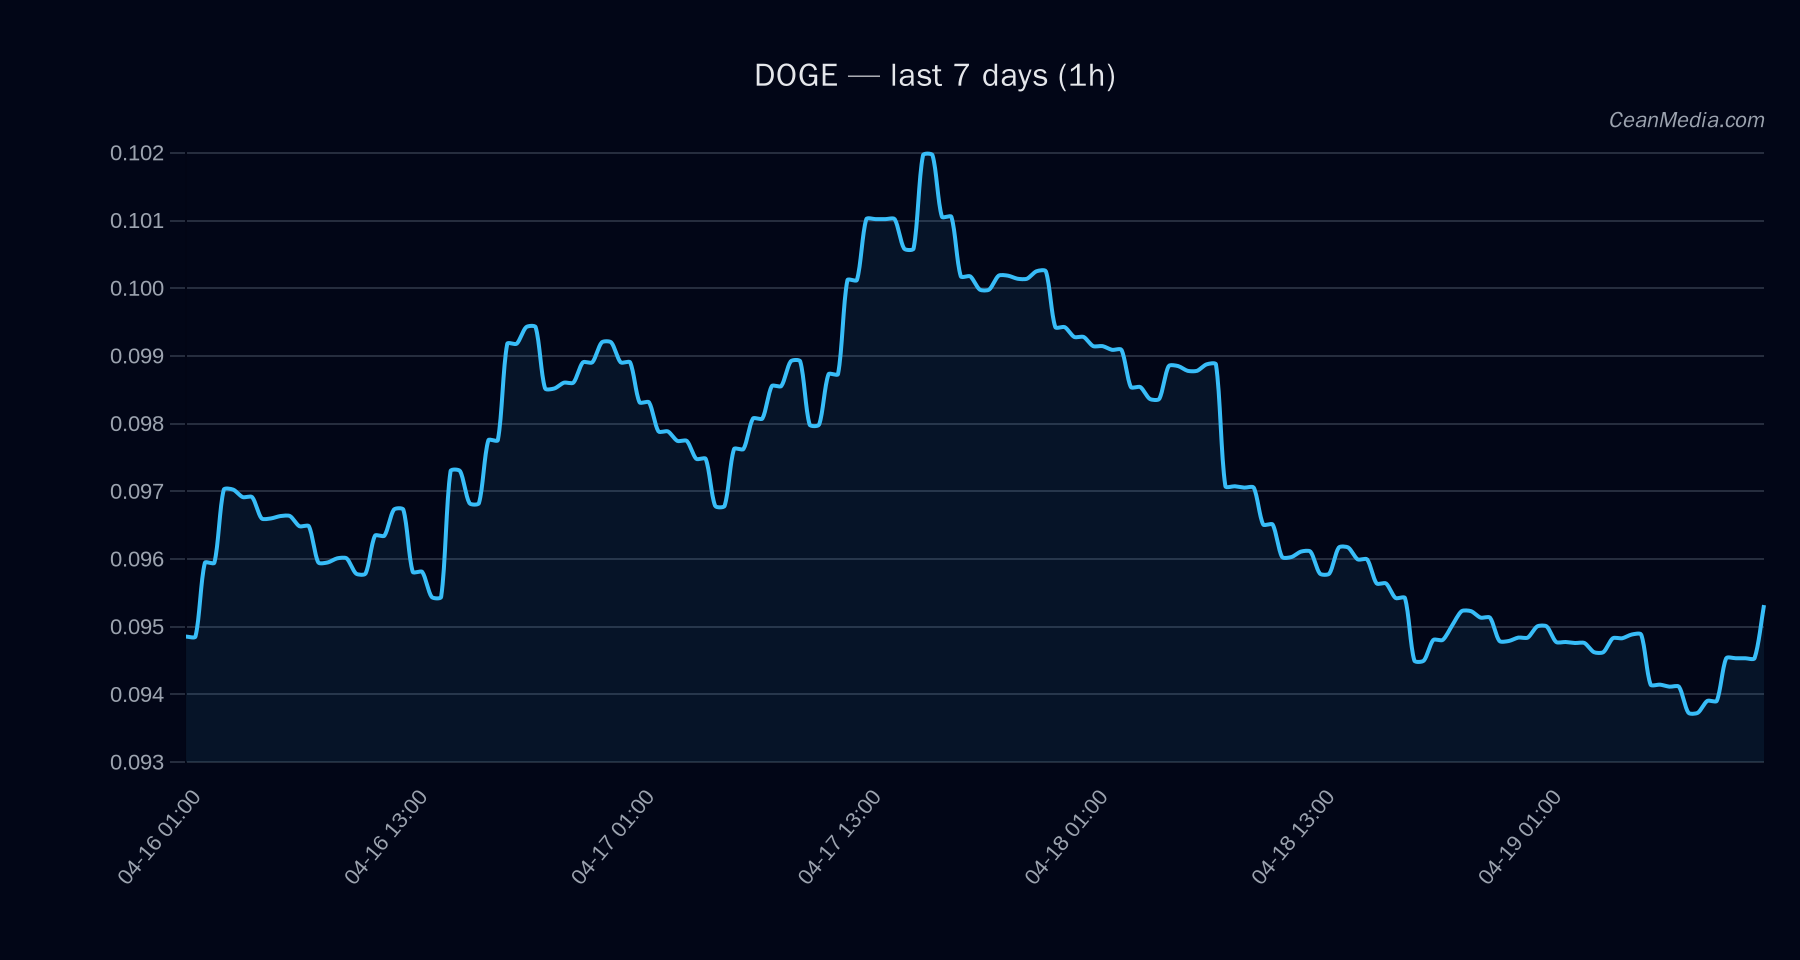
On 2026-04-19, DOGE trades around 0.095 with a short-term bias leaning up per the latest technical view. The band suggests a narrow range, with a P50 near 0.0942 and a P20–P80 band of 0.0917–0.0973. The market context shows very low volatility and a breadth backdrop that is currently modest, with F&G Fear/Greed index at a mid-low level and BTC.D showing a slight uptick over 7 days.
Technical Analysis: DOGE
Price is between 0.093 support and 0.097 resistance. A close > 0.097 opens a path toward 0.0988–0.1008; a close < 0.093 targets 0.0912–0.0894. Short-term forecast is up (53% probability). TA condition notes sideways movement with EMA12 Major support 0.091, near-term support 0.093; major resistance 0.097, near-term resistance 0.097. RSI at 47 (neutral), σ24h 0.37% (low volatility). EMA/SMA alignment suggests mixed trend signals in the near term. Break above 0.097 triggers upside to 0.0988–0.1008; break below 0.093 invalidates near-term upside and raises risk toward 0.0912–0.0894.
Drivers
Depth Z-score (-2.18 contrib; value -19.45) and Spread Z-score (1.9 contrib; value -5.61) are notable, indicating pressure from order book imbalances and liquidity dispersion. RV 7D (+0.54 contrib; value -1.06) and trend-related metrics show moderate momentum signals but overall very low vol regime. Distance from moving average at -0.0087, suggesting slight deviation from short-term average without extreme divergence. BTC-related signals (BTC return 24h: -0.0026; BTC vol regime: -1) indicate a risk-on/off backdrop that may influence crypto sentiment modestly.
ETF Flows (BTC/ETH)
ETF flow data is provided for BTC and ETH as context. Flows show sustained net buying in BTC and ETH ETFs over 1D/5D/10D horizons, implying a broader risk-on environment and allocation shifts toward major cap assets. It is important to note that ETF flow data is not a primary signal for DOGE; it serves as contextual market sentiment that may influence risk appetite and liquidity conditions across crypto markets.
- BTC ETF: +$634.8M (1D), +$630.2M (5D), +$1.22B (10D)
- ETH ETF: +$132.7M (1D), +$222.8M (5D), +$263.1M (10D)
What to Watch Next
- Close above 0.097 to target 0.0988–0.1008; monitor intraday price action for a potential breakout or false breakout.
- Key support at 0.093; a break below could shift risk toward 0.0912–0.0894.
- Monitor volatility regime and RSI for any signs of momentum pick-up or diverging trend strength.
- Keep an eye on BTC/ETH ETF flow momentum as a contextual backdrop for risk appetite, while recognizing it is not a direct signal for DOGE.
Hashtags: #DOGE #CryptoAnalysis #TechnicalAnalysis #BTCETF #ETHETF #MarketSnapshot #Momentum #SupportResistance #Volatility #RiskOn #CryptoFlows