Market Snapshot
On 2026-04-19, LINK traded around 9.24 with a short-term forecast skewed to the upside (64%). The current band spans 8.52 to 9.80, with near-term support at 9.06 and resistance at 9.42. Market breadth indicators show very low volatility regime and RSI at 44, suggesting a neutral to slightly cautious stance in the near term.
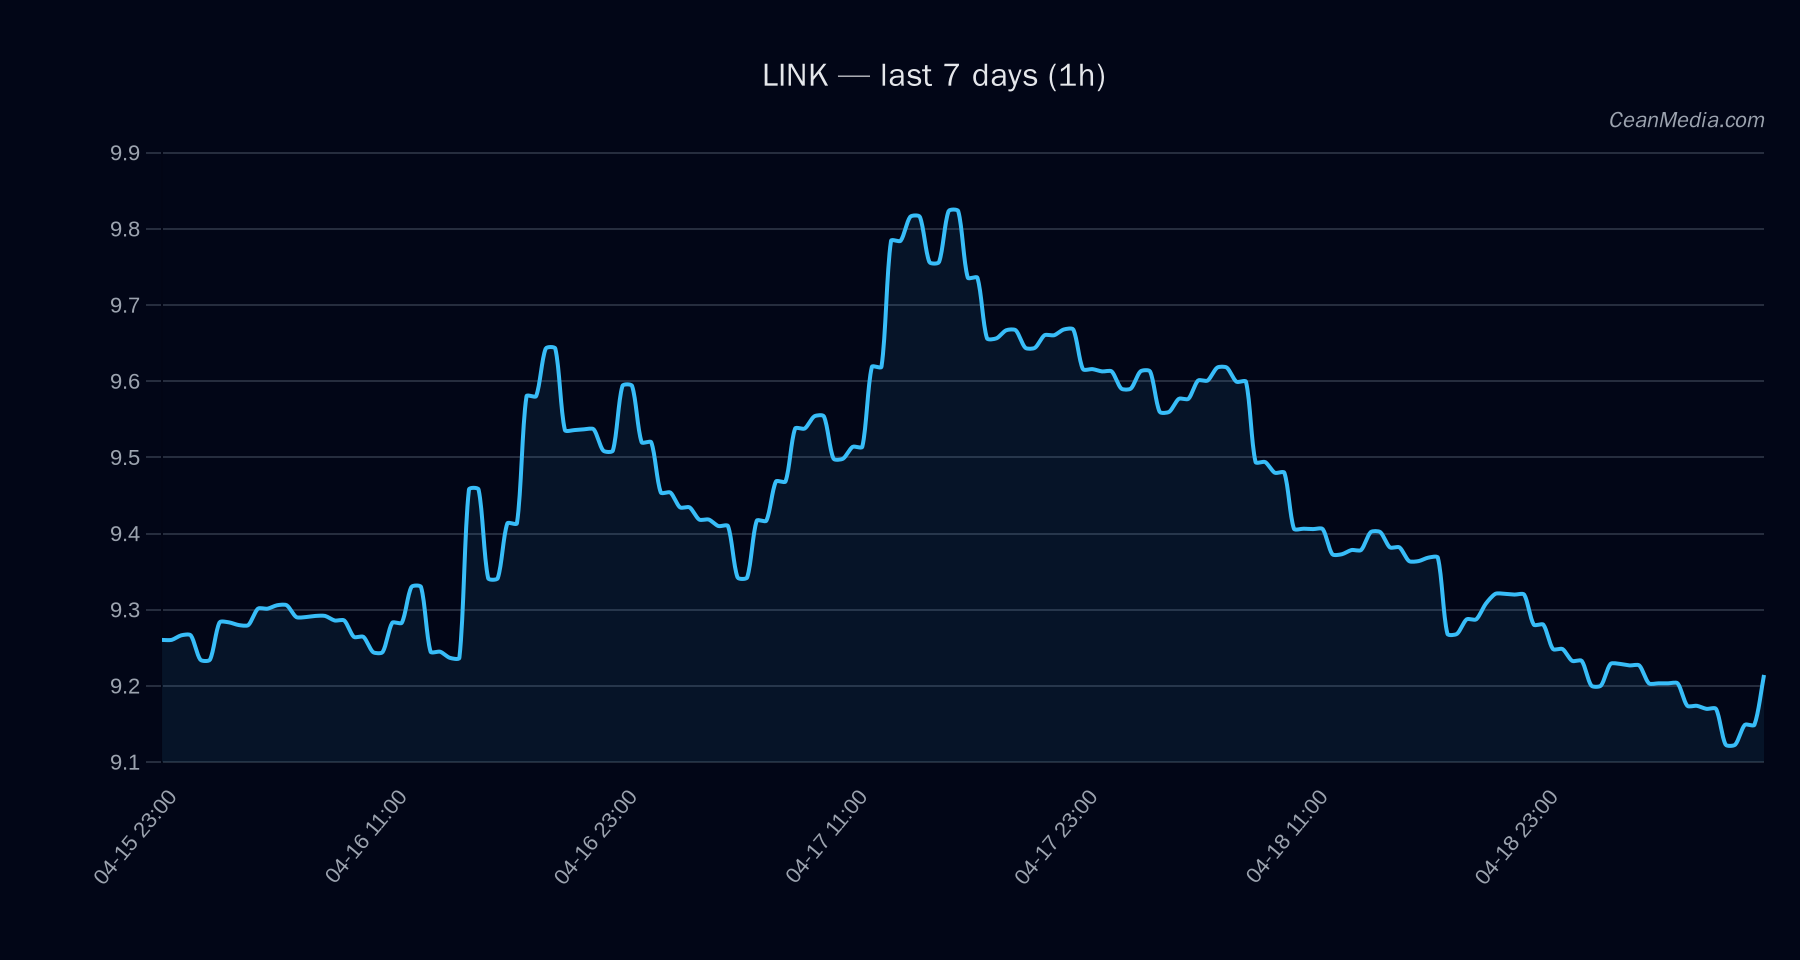
Technical Analysis: LINK
- Current price: 9.24
- Forecast: Up (64% probability over the next 24 hours)
- Key levels:
- Support (Major): 8.64
- Support (Near): 9.06
- Resistance (Near): 9.42
- Resistance (Major): 9.42
- Breakout/triggers:
- Upside trigger: 1h close > 9.42 → potential move toward 9.6133–9.8018
- Downside trigger: 1h close < 9.06 → potential move toward 8.8741–8.693
- Momentum/volatility:
- RSI: 44 (neutral)
- Vol regime: Very low
- EMA12 < EMA26, SMA50 > SMA200 (mixed trend signals)
- σ24h: 0.38% (low volatility)
- Band: P20–P80 = 8.5155 – 9.803
- Probabilities (up/sideways/down): 64% / 7% / 29%
Drivers
- Depth USD 10bp log1p: positive contribution (0.91; value -4.56)
- LS Global Delta 24h: positive contribution (0.81; value 2.23)
- BTC RV 24h: negative contribution (-0.78; value -1.18)
- Spread BP: negative contribution (-0.7; value -1.77)
- Depth Z-score: negative contribution (-0.62; value -6.83)
- BTC Vol Regime: minor positive signal (0.39; value -1.52)
- RV 24H: positive signal (0.3; value -1.19)
ETF Flows (BTC/ETH)
Contextual note: ETF flow data shown here covers BTC and ETH only and is intended to provide a market breadth backdrop. It is not a primary signal for LINK. Observed data:
- BTC ETF: +$634.8M (1D), +$630.2M (5D), +$1.22B (10D)
- ETH ETF: +$132.7M (1D), +$222.8M (5D), +$263.1M (10D)
What to Watch Next
- Watch for a daily close above 9.42 to validate the upside breakout target toward 9.61–9.80.
- Monitor if price revisits support at 9.06; a break below could accelerate a move toward 8.87–8.69.
- Keep an eye on RSI movement; a rise toward mid-40s to 50 could accompany a bullish continuation if accompanied by a trend-confirming breakout.
- Consider derivative and depth signals in tandem with BTC/ETH ETF flows for broader market context, while remaining aware that LINK’s primary signal is price action and on-chain signals rather than ETF flows alone.
Hashtags: #LinkAnalysis #CryptoMarkets #TechnicalAnalysis #PriceAction #ETFFlows #BTC #ETH #MarketStructure #CryptoNews