Market Snapshot
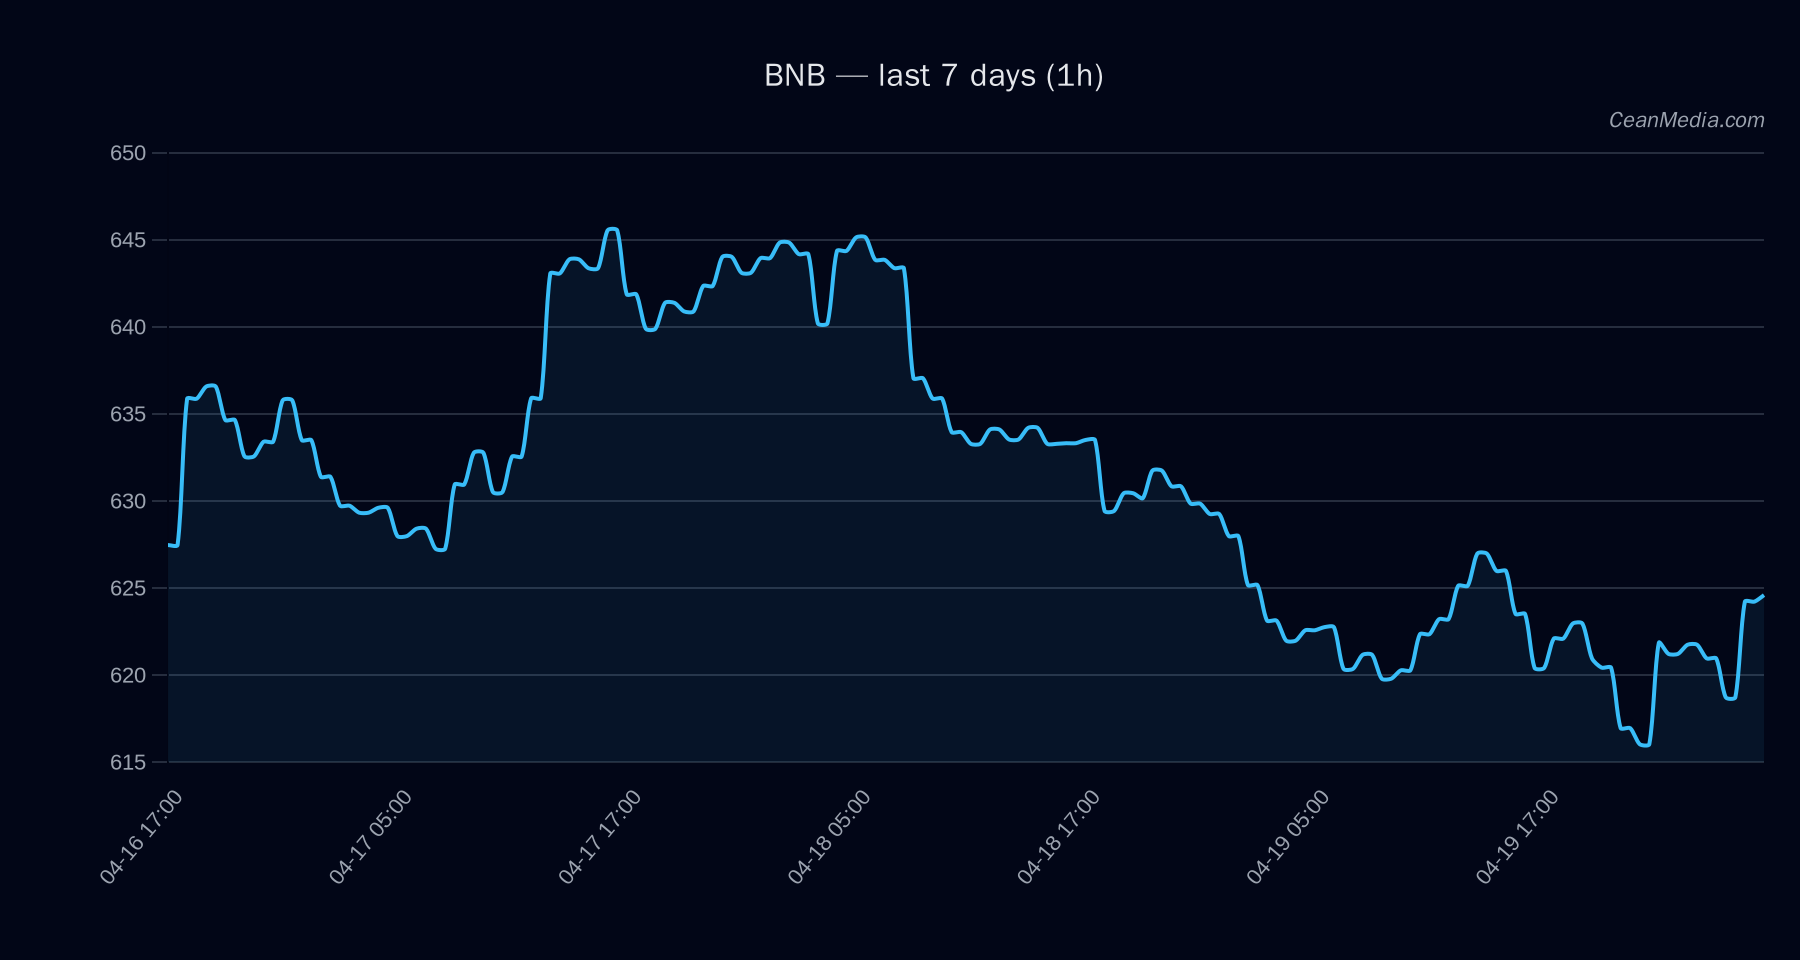
On 2026-04-20, BNB traded around the 625 level with a short-term bias toward the upside. The price sits between defined support at 613 and resistance at 638. Key signals indicate a sideways to mildly bullish posture, supported by a neutral RSI around 54 and low volatility regime. The broader context shows a cautious risk environment with Fear/Greed indicators in the mid-range and BTC.D modestly rising, suggesting subdued alt-coin breadth at present.
Technical Analysis: BNB
- Price: 625.02
- Short-Term Forecast: Up (64%)
- Band: P20–P80 = 610.48 – 650.82
- Support / Resistance: Major Support 594; Near Support 613; Major Resistance 631; Near Resistance 638
- Trend Indicators: EMA12 < EMA26, SMA50 > SMA200; RSI 54; Volatility (σ24h) 0.37%; Volume regime: Very low
- Upside/Downside Triggers: Upside if 1h close > 638 → 650.27–663.02; Downside if 1h close < 613 → 600.27–588.02
- Context: Breadth >50h at 0%, BTC 72h correlation 0.82, Vol regime Very low, Fear/Greed index 29 (Fear), BTC.D 57.5%
Drivers
- Top Drivers: Return 24h, EMA slope, Funding Z-score, Basis Z-score, Order-book Imbalance (EMA5), BTC return 24h
- Notable Signals: SPREAD Z-SCORE positive contribution but value negative; LS TOP Z-SCORE positive; LS GLOBAL Z-SCORE negative; RV 24h and 7D show mixed signals
- Implication: The combination of a neutral RSI, sideways EMA signals, and modest positive price drift supports a cautious upside bias unless a break below 613 occurs.
ETF Flows (BTC/ETH)
The ETF flow data provided covers BTC and ETH only, and should be interpreted as context rather than a primary signal for BNB. Current figures show robust BTC ETF inflows and smaller but positive ETH inflows over the 1D/5D/10D windows. These flows indicate renewed demand in larger-cap crypto vehicles and are consistent with a risk-on appetite in broader crypto markets, but do not directly validate BNB-specific moves.
- BTC ETF: 1D +$634.8M | 5D +$630.2M | 10D +$1.22B
- ETH ETF: 1D +$132.7M | 5D +$222.8M | 10D +$263.1M
What to Watch Next
- Watch for a close above 638 to confirm the near-term upside target toward 650.27–663.02.
- Monitor a break below 613 as an early warning of a deeper correction toward 600.27–588.02.
- Observe changes in volatility regime and breadth signals for potential regime shifts (e.g., emergence of a higher vol regime).
- Keep an eye on BTC/ETH ETF flow momentum as a corroborating context for risk-on risk-off dynamics, while maintaining that these are auxiliary indicators for BNB.
Hashtags: #BNB #CryptoAnalysis #TechnicalAnalysis #ETFFlows #BTC #ETH #MarketSnapshot #Altcoins #PriceAction #RiskOn #Liquidity