Market Snapshot
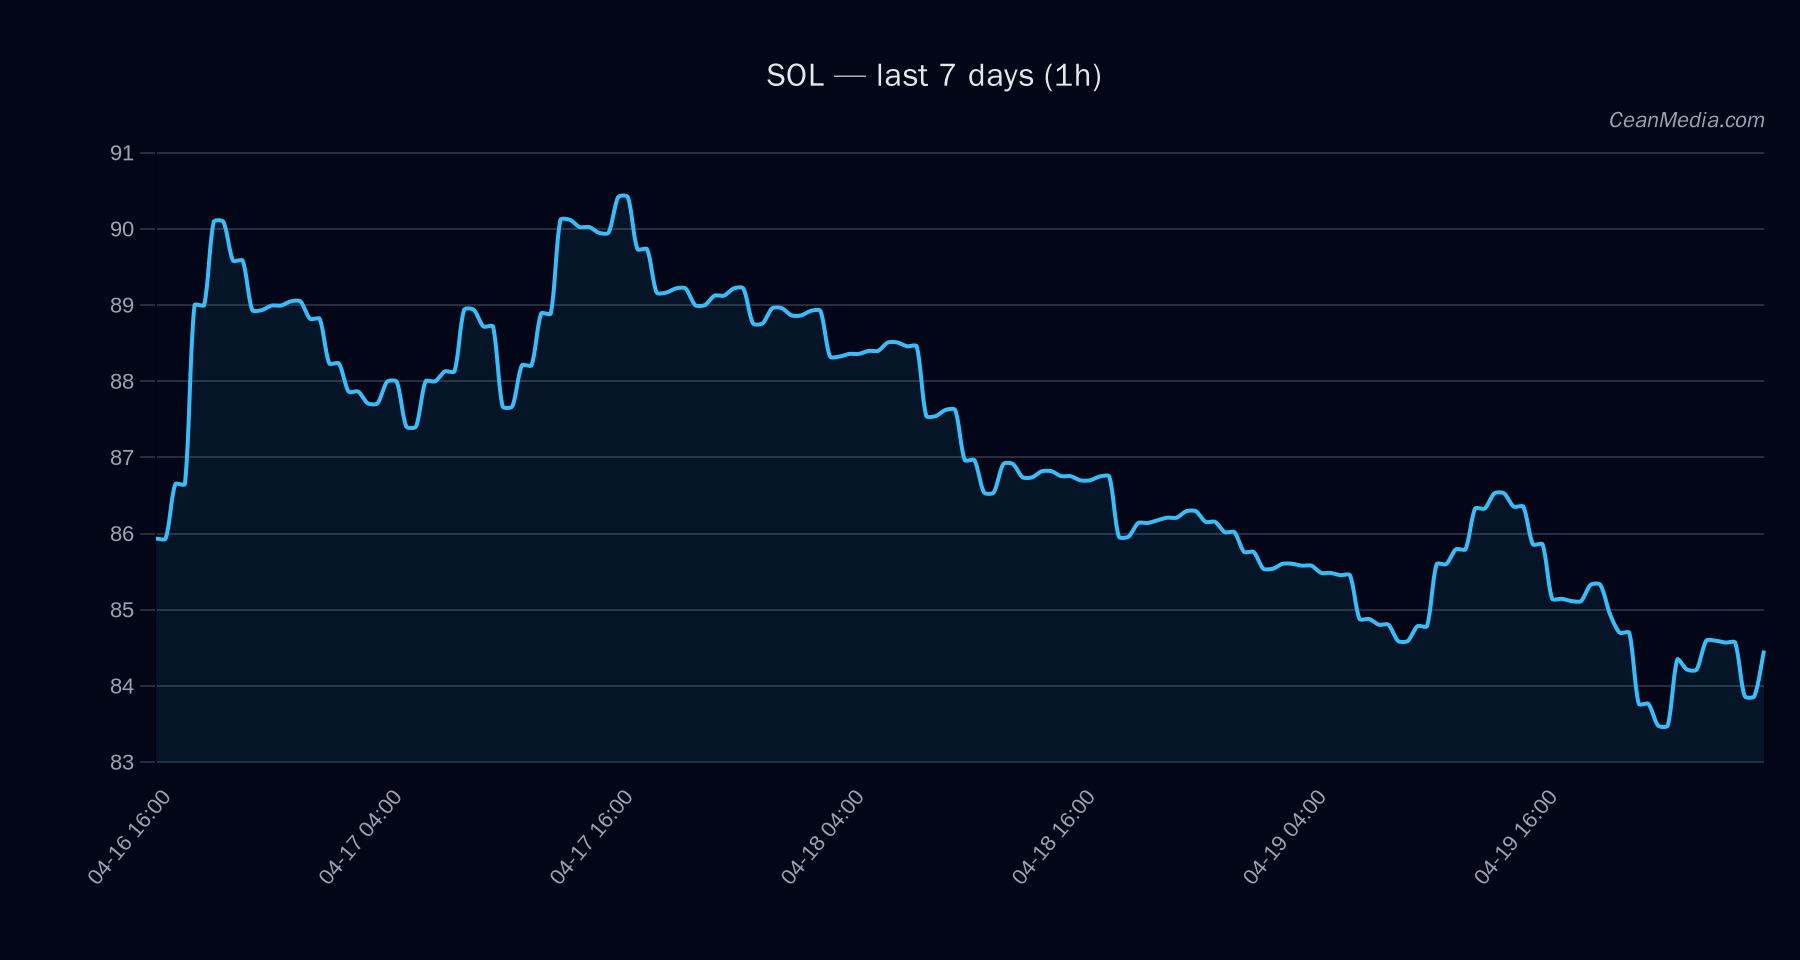
Solana (SOL) trades around the high-80s zone with a current price near 84.82. The model indicates a short-term forecast of upside probability around 53%, with a broader sideways TA context evidenced by EMA crossovers and a neutral RSI of 47. The immediate support and resistance bands are 80.1 (major) and 87.3 (major), with near-term pivots at 83.1 and 86.5 respectively. Breakouts above 86.5 suggest a potential move toward the 88.25–89.98 range; a break below 83.1 indicates a move toward 81.46–79.80. Overall volatility is described as very low, consistent with a muted market backdrop.
Technical Analysis: SOL
: - Support (Major): 80.1
- Support (Near): 83.1
- Resistance (Near): 86.5
- Resistance (Major): 87.3
: - Upside trigger: 1h close > 86.5 → potential 88.25–89.98
- Downside trigger: 1h close < 83.1 → potential 81.46–79.80
- EMA12 < EMA26
- SMA50 > SMA200
- RSI: 47 (neutral)
- Vol regime: Very low
- σ24h: 0.58% (low volatility)
Drivers
: - LS TOP Z-SCORE: contributing -4.79 (value -3.3)
- SPREAD BP: contributing 1.98 (value 5.47)
- LS GLOBAL Z-SCORE: contributing 1.94 (value -1.69)
- SPREAD Z-SCORE: contributing 1.3 (value -4.18)
- LS GLOBAL DELTA 24H: contributing 0.95 (value 1.87)
- LS TOP DELTA 24H: contributing -0.71 (value 1.87)
: - Depth USD 10BP LOG1P: 0.46 (value -5.03)
- TBI EMA10: -0.42 (value 3.53)
- Momentum and breadth indicators point to a cautious stance with low volatility and mixed directional signals.
ETF Flows (BTC/ETH)
Contextual note: ETF flow data provided here pertains to BTC and ETH only. These flows are not a primary signal for SOL trades but can contextually reflect broader market risk sentiment and liquidity conditions.
- BTC ETF: 1D +$634.8M; 5D +$630.2M; 10D +$1.22B
- ETH ETF: 1D +$132.7M; 5D +$222.8M; 10D +$263.1M
The ETF flow momentum indicates renewed risk-on appetite in BTC and ETH over the 1–10 day horizon, which may support broader market risk sentiment. However, SOL-specific moves will depend on SOL-specific catalysts and crypto market structure rather than ETF flows alone.
What to Watch Next
- Watch for a daily close above 86.5 to validate the upside trigger toward 88.25–89.98.
- Monitor price action if SOL tests 83.1: a break below could accelerate toward 81.46–79.80.
- Observe changes in volatility regime; a shift from very low to higher volatility could precede a directional breakout.
- Keep an eye on BTC/ETH ETF flow trends and overall market risk sentiment as contextual signals.
Hashtags: #SOL #Solana #CryptoAnalysis #MarketStrategy #ETFFlows #BTC #ETH #RiskOn #TechnicalAnalysis #PriceAction #Liquidity #MarketPulse