Market Snapshot
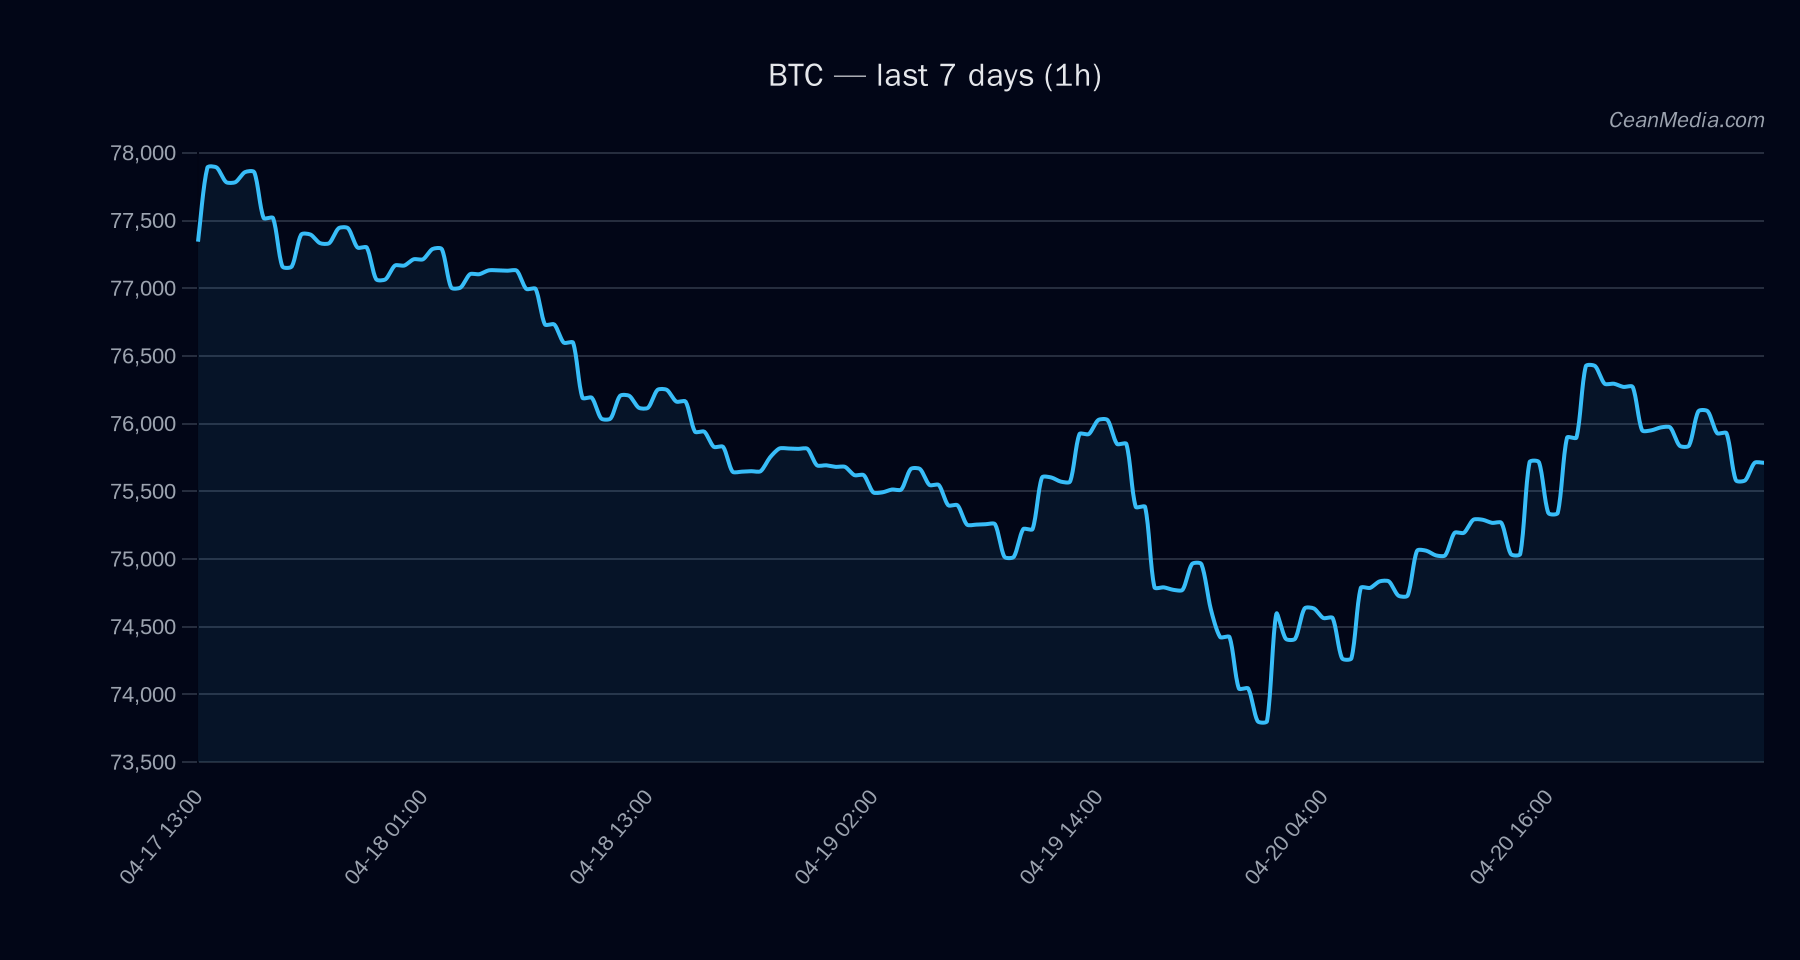
As of 2026-04-21, Bitcoin (BTC) trades in a tight range, with near-term momentum modestly positive. The price sits around 75,651.9, with a broad support band at 74,150 and a nearby resistance at 77,175. The market shows a very low volatility regime and a neutral RSI around 51, suggesting balanced near-term pressure rather than clear directional acceleration.
Technical Analysis: BTC
Price 75,651.9; Major support 74,150; Major resistance 75,850; Near resistance 77,175; Near support 74,150. Short-Term Forecast: up (52%). Overall forecast sits in a bullish tilt within a defined range. Break above 77,175 targets 78,708.24–80,251.54. Break below 74,150 targets 72,656.08–71,173.31. EMA12 > EMA26; SMA50 > SMA200; RSI 51; volatility (σ24h) 0.39%; volume regime: Very low. Context: Breadth >50h at 67%, BTC.D around 57.6% (+0.3%/7d). Bullish case weakens on a close below 74,150; bearish case intensifies on a close above 77,175 with confirmation above that level. If break > 77,175, potential upside to 78,708.24–80,251.54. If break < 74,150, downside to 72,656.08–71,173.31.
Drivers
- Top contributors in the model include relative strength indicators and delta measures across 24h, with a mix of positive and negative signals reflected in Z-scores.
- Momentum signals show a cautious stance: RETURN 24H ~0.01%, EMA Slope ~-0.00017, FUNDING Z-Score ~-0.91, BASIS Z-Score ~-0.70, and OBI EMA5 ~0.12.
- Volatility regime is currently very low, indicating subdued trading ranges and potential for abrupt moves only on a break of key levels.
- Overall trend strength (trend_strength) ~0.735 suggests modest upward tilt within a defined channel.
ETF Flows (BTC/ETH)
The ETF flow data provided covers BTC and ETH. For BTC, the 1D flow shows -$17.6M, with a substantial positive 5D flow of +$927.3M and 10D flow of +$1.19B. ETH shows -$14.0M on 1D with +$206.2M (5D) and +$319.4M (10D). These figures reflect capital repositioning across BTC and ETH ETFs and should be interpreted as contextual risk-on/off signals rather than primary drivers for BTC price. In current context, persistent 5D and 10D inflows suggest growing institutional interest in crypto equity products, which may support upside bias if sustained.
What to Watch Next
- Watch for a breakout above 77,175 to validate a move toward 78,708–80,251 range.
- Monitor for a break below 74,150 which would open downside targets toward 72,656–71,173.
- Track ETF flow momentum in BTC/ETH as a supplementary signal to risk appetite, noting that ETF data is contextual rather than a primary BTC signal.
- Maintain attention on intraday volatility; a shift from Very Low regime could precede a more meaningful directional move.
Hashtags: #Bitcoin #BTC #ETFFlows #TechnicalAnalysis #MarketSnapshot #CryptoNews #CryptoFlows #BullishBias #SupportResistance #PriceAction #MarketMomentum
Note: ETF data presented here is BTC/ETH only and provided as context to gauge broader market risk appetite, not as the sole basis for BTC decisions.