Market Snapshot
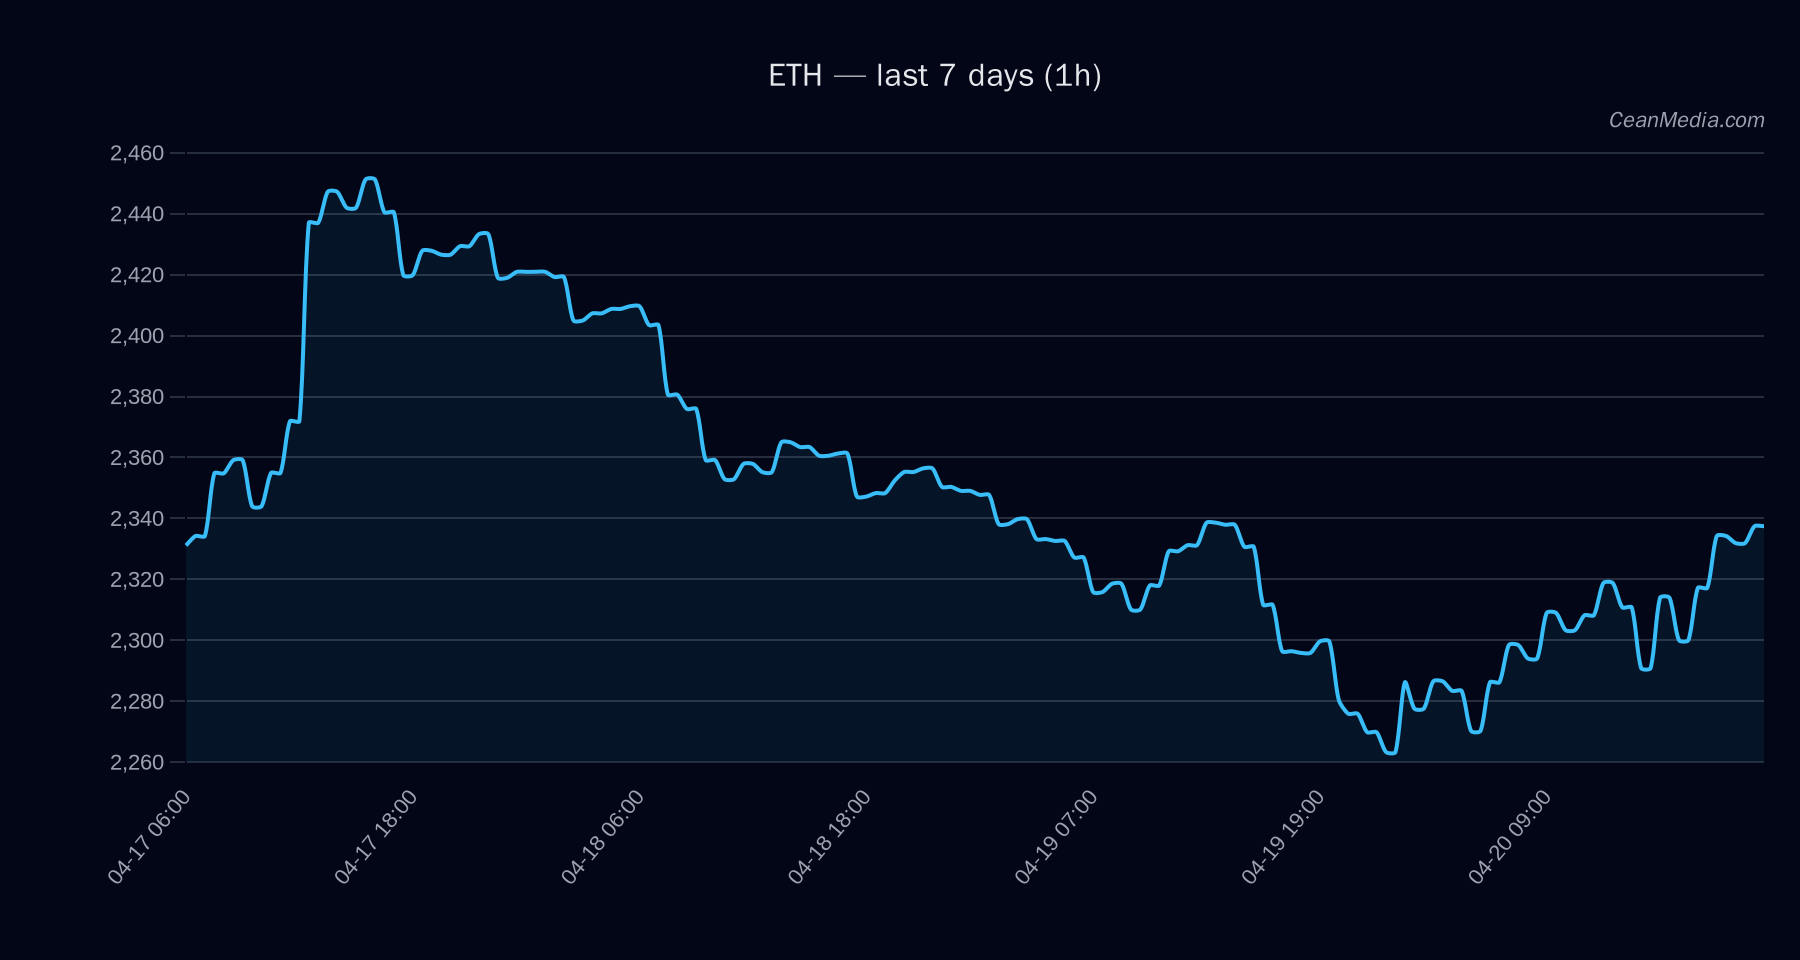
ETH hovered near key support and resistance with a short-term up bias indicated by the latest TA. The price sits between the major support at 2,146 and resistance at 2,362, with an intraday move potential toward 2,415–2,463 on a breakout above 2,368. Market breadth remains robust among alt assets, and overall volatility remains very low.
Technical Analysis: ETH
- Price (latest): 2,321.8
- Bias: Up (53% probability) under a sideways-leaning context (EMA12 > EMA26, SMA50 < SMA200, RSI 54, vol regime: very low).
- Key levels:
- Support (Major): 2,146
- Support (Near): 2,276
- Resistance (Near): 2,368
- Resistance (Major): 2,362
- Trade targets: Break > 2,368 signals potential move to 2,415.60–2,462.97. Break < 2,276 signals potential move to 2,229.86–2,184.35.
- Top model drivers (high impact):
- Spread Z-Score: contributes 2.71, value -6.04
- LS TOP Z-Score: contributes -2.07, value -2.8
- Funding Z-Score: contributes -0.24, value 1.97
- Distance from MA: contributes -0.24, value 0.38
- OI Delta 24H: contributes -0.17, value 1.25
- Momentum/Volatility: 4-hour and 24-hour volatility are very low; RSI at 54 indicates a neutral stance for near-term momentum.
Drivers
- Return 24h: modestly positive
- EMA Slope: slight positive tilt
- Basis Z-Score: negative signal (neutral-to-soft downside pressure)
- OBI/EMA5: minor negative imbalance
- BTC Return 24h: small positive correlation (0.02)
- BTC Trend/Volatility: BTC relationship remains supportive with high correlation (ρ 0.9 over 72h) but BTC volatility regime is currently neutral to low
ETF Flows (BTC/ETH)
Contextual note: ETF flow data shown below is limited to BTC and ETH and is provided for market context rather than as a primary signal for ETH price action.
- BTC ETF: 1D +$634.8M | 5D +$630.2M | 10D +$1.22B
- ETH ETF: 1D +$132.7M | 5D +$222.8M | 10D +$263.1M
What to Watch Next
- Monitor a sustained close above 2,368 to confirm the upside extension toward 2,415.60–2,462.97.
- Watch for a break below 2,276 to validate a potential move toward 2,229.86–2,184.35.
- Keep an eye on ETF flow developments for BTC as potential macro-risk-on/off signals, understanding that ETH flows are context-driven and not primary drivers.
- Observe changes in volatility regime; a shift from very low to higher volatility could alter the immediate risk-reward profile.
Hashtags: #ETH #Ethereum #MarketAnalysis #CryptoTrading #TechnicalAnalysis #ETFFlows #BTC #AltMarkets #CryptoNews #PriceAction #Liquidity