Market Snapshot
Solana (SOL) trades around the mid-80s, with the near-term picture showing a potential uptick bias against a backdrop of very low volatility. The latest readings place SOL between a major support at 80.6 and a major resistance at 87.3, with an intra-band forecast suggesting upside in the 24-hour horizon.
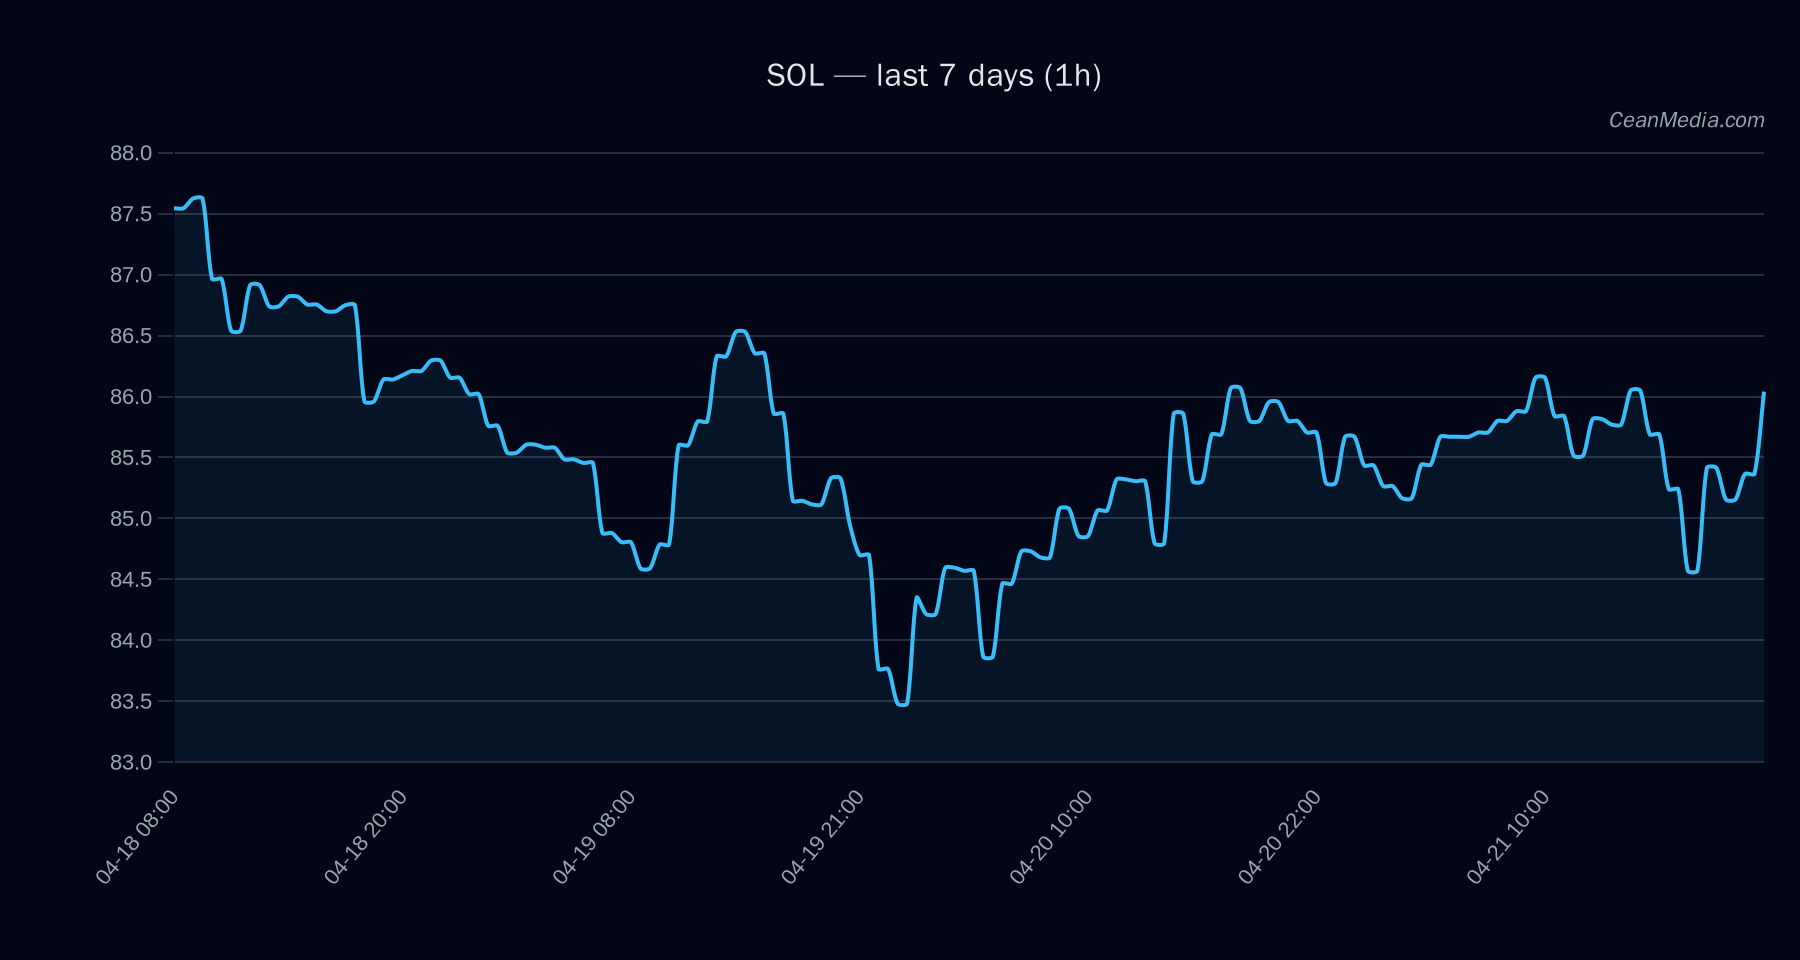
Technical Analysis: SOL
- Current price (approx): 86.38
- Short-Term Forecast: Up (52%)
- Key indicators: EMA12>EMA26, SMA50
- Support / Resistance: Major Support 80.6 | Near Support 84.7; Near Resistance 88.1 | Major Resistance 87.3
- Target ranges: Upside if 1h close > 88.1 → 89.87–91.63
- Invalidation/Downside: If 1h close < 84.7 → 82.96–81.27
- Band context: P20–P80: 80.61–90.05; P50: 86.30
- Bias: Upwards bias with sideways elements; RSI neutral at 59
The narrative is supported by a narrow price range and a tilt toward upside continuation if key resistance at 88.1 is broken. A break below the 84.7 level would shift the near-term risk toward the downside band below 82.96.
Drivers
- Return 24H: 0.89%
- EMA slope: modest positive (0.0011)
- Funding Z-Score: positive signal (0.19)
- Basis Z-Score: positive signal (0.25)
- OBI EMA5 (order-book imbalance): small positive influence (0.06)
- BTC 24H Return: +0.65%
- Overall trend strength: 0.43 (moderate)
Additional context shows breadth and BTC correlation supporting a constructive stance, though the volatility regime remains very low, suggesting limited momentum bursts in the near term.
ETF Flows (BTC/ETH)
Context notes: ETF flow data is provided for BTC and ETH and is not a primary signal for SOL. Flows indicate broader market risk appetite. Positive BTC/ETH flows can reflect risk-on sentiment, but should be integrated with SOL-specific TA and macro factors.
- BTC ETF: 1D +$238.4M; 5D +$1.18B; 10D +$1.45B
- ETH ETF: 1D +$75.3M; 5D +$295.5M; 10D +$408.7M
What to Watch Next
- Watch for a daily close above 88.1 to validate upside scenario toward 89.87–91.63.
- A break and daily close below 84.7 would shift focus to potential retests of 82.96–81.27.
- Monitor volatility regime; very low volatility may precede a breakout if liquidity conditions improve.
- Track BTC/ETH ETF flow momentum as contextual backdrop for risk appetite but rely primarily on SOL-specific TA for trading decisions.
Hashtags: #Solana #SOL #CryptoAnalysis #TechnicalAnalysis #ETFFlows #BTC #ETH #MarketDepth #CryptoMarkets #PriceAction #TradingSignals