Market Snapshot
LINK is trading around the psychological 9.40 handle with near-term support at 9.24 and resistance at 9.62. The broader context shows very low volatility with a focused range over the next 24 hours. Breadth indicators remain positive, while on-chain and order-book signals present mixed pressures. BTC and ETH ETF flows show notable demand, which provides a macro backdrop but is not the primary driver for LINK’s price action today.
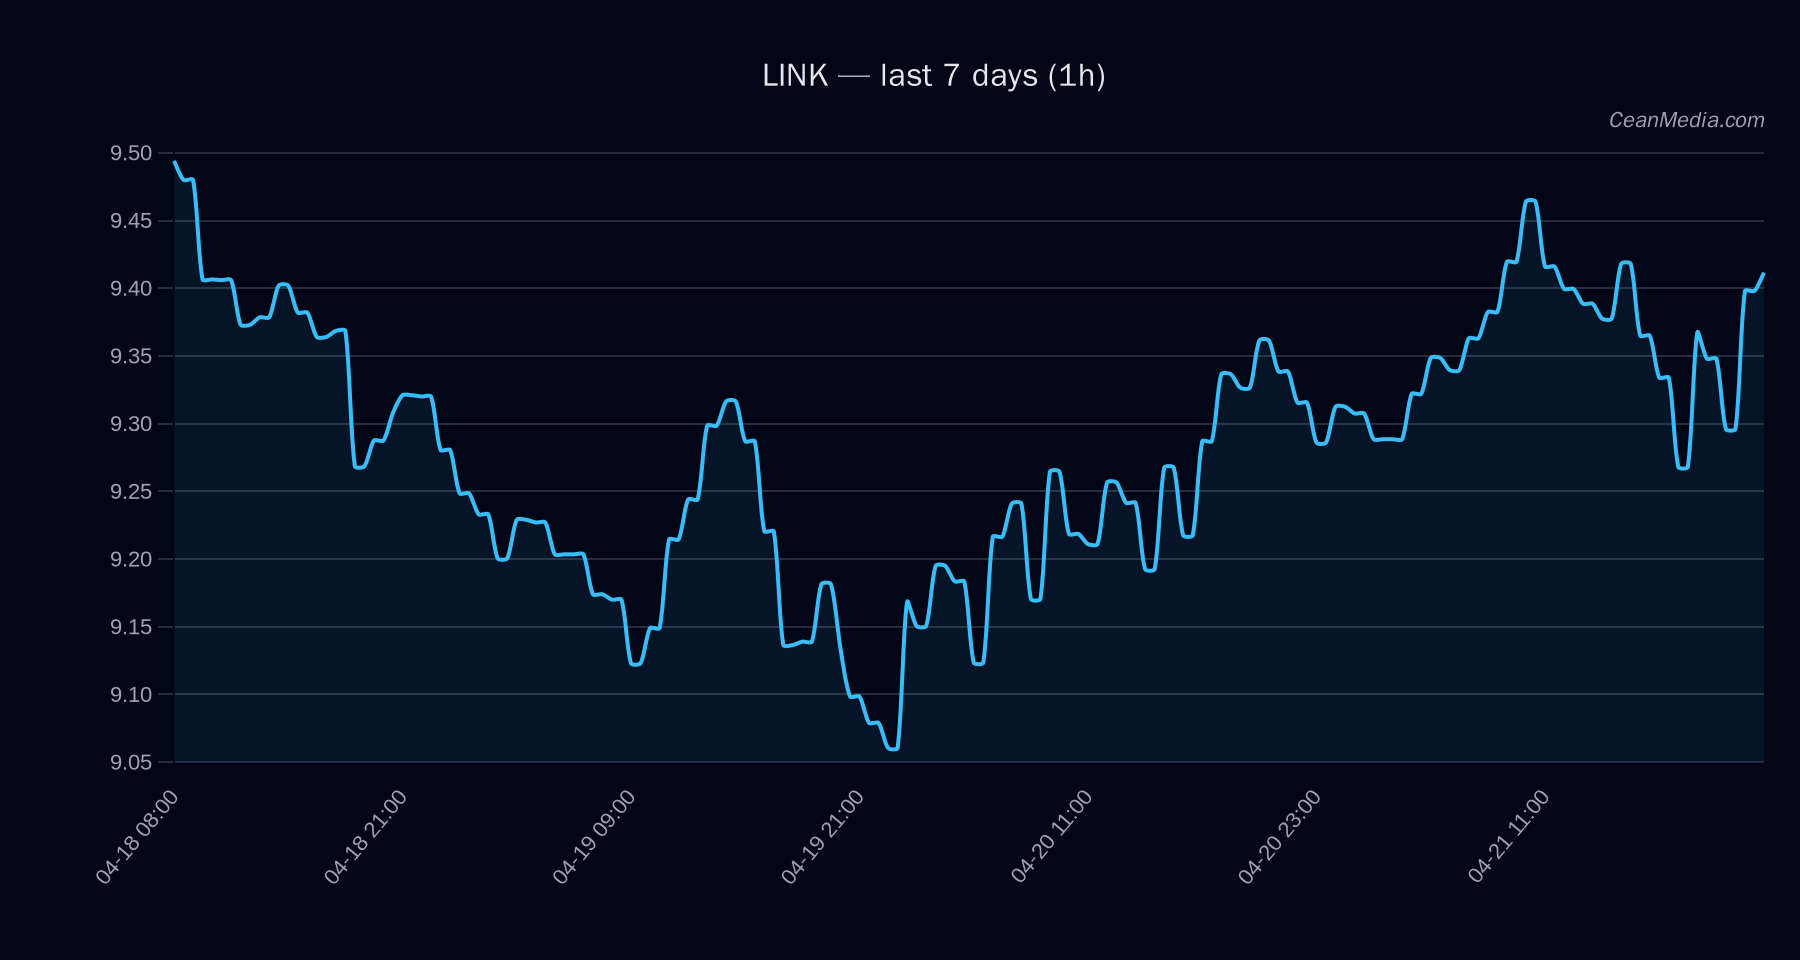
Technical Analysis: LINK
- Current price: 9.43
- Near-term bias: Down (53%), with sideways tendencies as of the latest TA readings.
- Key levels:
- Support (Major): 8.74
- Support (Near): 9.24
- Resistance (Near): 9.62
- Resistance (Major): 9.42
- Break triggers:
- Break above 9.62 → potential move toward 9.811 – 10.0033
- Break below 9.24 → potential move toward 9.0566 – 8.8717
- Indicators: EMA12>EMA26, SMA50
- Forecast: Down (53%) with a sideways TA footprint in the immediate term.
- Invalidation levels: Break above 9.62 or below 9.24 would adjust the near-term trajectory accordingly.
Drivers
- Top drivers include Depth USD 10bp log1p, SPREAD BP, Depth Z-Score, and liquidity-related metrics (EMA12-based).
- Momentum indicators show a modest tilt lower, with trend strength around 0.47 and distance from MA near 0.01.
- Market breadth context is positive (breadth > 50h: 100%), while volatility remains very low, reducing the likelihood of sharp swings in the immediate term.
ETF Flows (BTC/ETH)
The ETF flow data provided focuses on BTC and ETH with substantial one- and multi-day inflows, signaling risk-on appetite in the broader crypto market. This context can influence sentiment and capital allocation, but it should be treated as contextual rather than a primary signal for LINK-specific moves.
- BTC ETF 1D +$238.4M | 5D +$1.18B | 10D +$1.45B
- ETH ETF 1D +$75.3M | 5D +$295.5M | 10D +$408.7M
What to Watch Next
- Monitor intraday price action around 9.62 for potential breakout bias.
- Observe any breach of 9.24 for quick risk-off moves toward 9.06–8.87.
- Track changes in volatility regime; a shift away from Very Low could precede larger moves.
- Keep an eye on BTC/ETH ETF flow momentum as a contextual gauge for overall market risk sentiment.
Hashtags: #LINK #CryptoMarkets #TechnicalAnalysis #ETFFlows #BTC #ETH #MarketSnapshot #RiskOn #Liquidity #PriceAction #TA #CrpytoNews