Market Snapshot
Cardano (ADA) is trading near the 0.245–0.255 range, with a near-term bias leaning modestly upward per the latest TA. The instrument sits between major support at 0.24 and major resistance at 0.255. A confirmed break above 0.255 could open a path toward 0.2598–0.2649, whereas a break below 0.245 would target 0.2398–0.2349. Market breadth indicators are subdued, and the current volatility regime is described as very low.
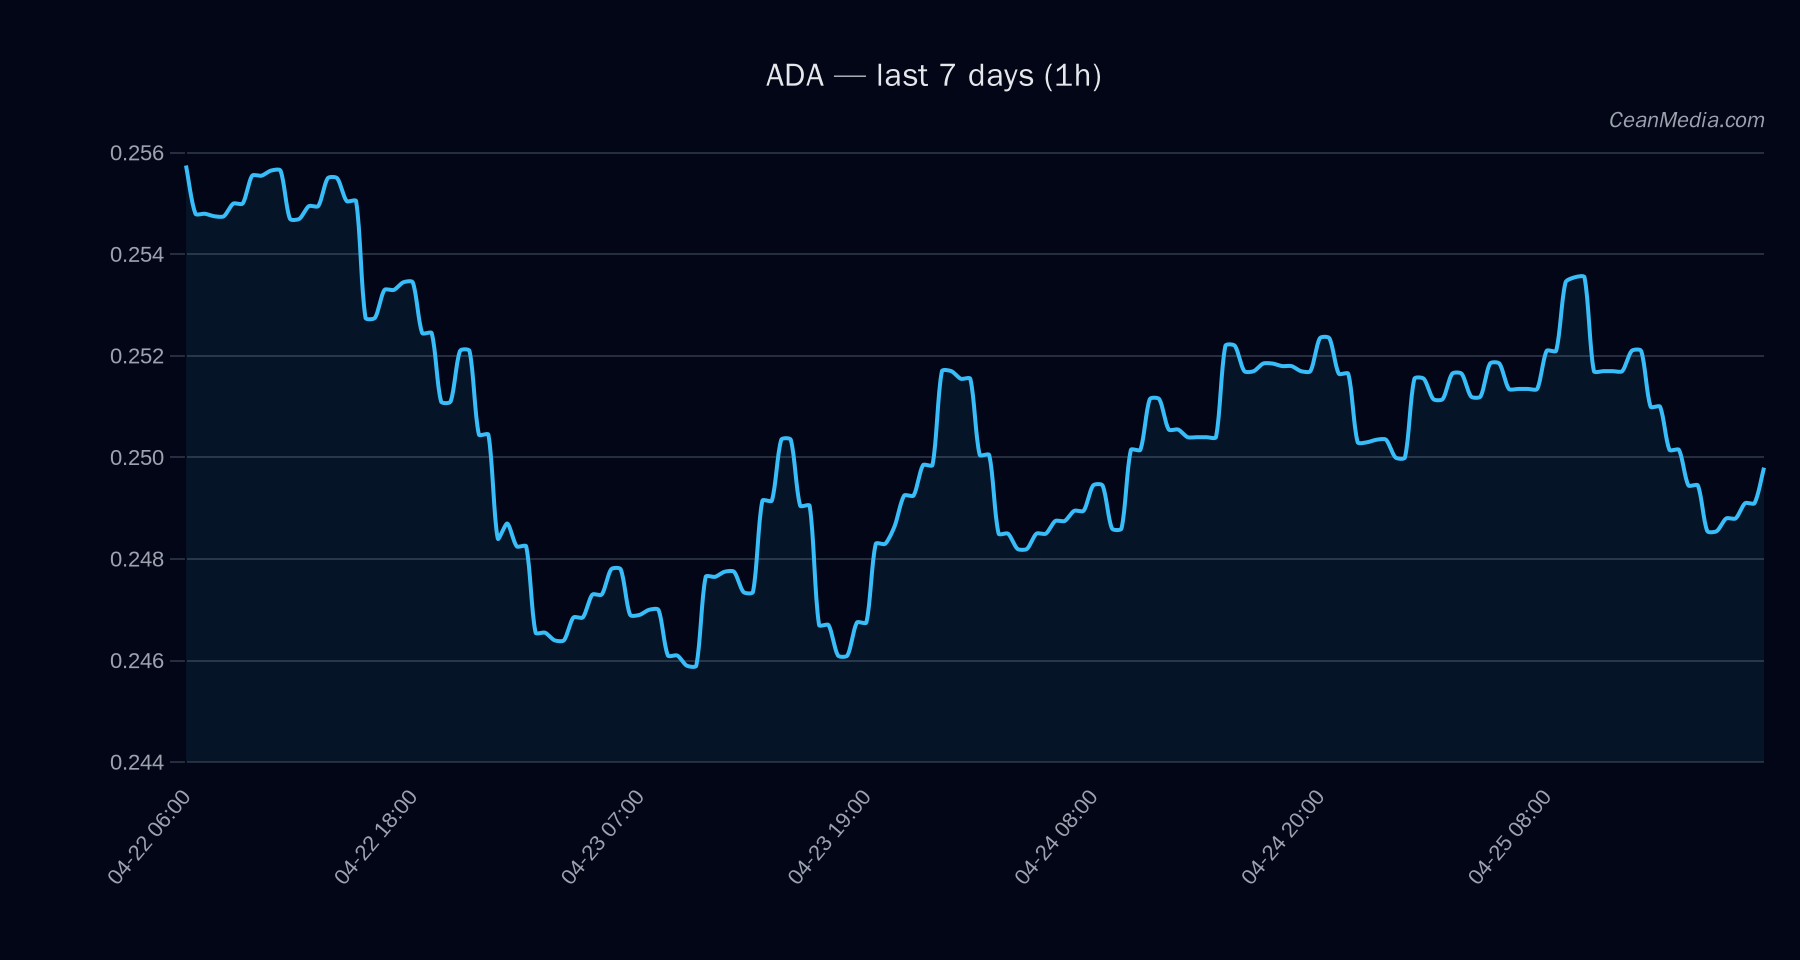
Technical Analysis: ADA
- Current Price: 0.2497
- Short-Term Forecast: Up (50% probability)
- Key Levels:
- Support (Major): 0.24
- Support (Near): 0.245
- Resistance (Near): 0.255
- Resistance (Major): 0.255
- Bias and Indicators: EMA12 < EMA26, SMA50 < SMA200, RSI 45, Volatility (σ24h) 0.32%, Vol regime: Very low
- Upside Scenario: 1h close > 0.255 → 0.2598–0.2649
- Downside Scenario: 1h close < 0.245 → 0.2398–0.2349
- Band Width (P20–P80): 0.2452–0.2626
- Top Model Drivers (high impact):
- Order-Book Imbalance (EMA5): positive signal (0.1) but overall moderation from other signals
- RV 7D: 0.96 contrib, value -2.38
- LS TOP DELTA 24H: 0.72 contrib, value 2.38
- Spread BP/Z-Score: mixed signals
- BTC-related metrics (BTC return 24h, BTC vol regime, BTC trend strength) indicate external influence but not a direct ADA signal
Drivers
- Top 6 drivers show a mix of liquidity, order-book dynamics, and short-term momentum, with notable contributions from RV 7D and LS TOP DELTA 24H.
- BTC-related factors are modestly influential: BTC return 24h is slightly negative, while BTC trend strength remains positive but not decisive for ADA’s immediate direction.
- Overall volatility regime remains Very Low, suggesting basing conditions with limited breakout potential in the near term.
ETF Flows (BTC/ETH)
The table below summarizes ETF flow context for BTC and ETH, which is provided as a market context rather than a primary signal for ADA. The data reflect recent daily and multi-day changes and may influence risk sentiment broadly, particularly in a risk-on/off environment.
- BTC ETF: 1D -$8.5M; 5D +$363.9M; 10D +$994.1M
- ETH ETF: 1D -$2.3M; 5D +$77.8M; 10D +$300.6M
Interpretation: The BTC/ETH ETF flows show a net higher draw in the most recent 1D window for BTC, with larger multi-day inflows across both BTC and ETH. This pattern can accompany broader risk appetite improvements, though the single-asset ADA signal remains driven by its own technicals. The ETF data should be used as contextual risk-on/off cues rather than primary drivers for ADA trading decisions.
What to Watch Next
- Monitor for a close above 0.255 to validate the upside target toward 0.2598–0.2649.
- Watch for a break below 0.245 to confirm a path toward 0.2398–0.2349.
- Assess changes in volatility regime and intraday volumes, which may precede a shift in trend strength.
- Keep an eye on BTC/ETH ETF flow shifts as broader market risk appetite may impact ADA indirectly.
Hashtags: #ADA #Cardano #CryptoAnalysis #MarketOverview #TechnicalAnalysis #ETFFlows #BTC #ETH #MarketSentiment #PriceAction #Liquidity #Volatility