Market Snapshot
Price: 0.0979. Short-Term Forecast: up (51%). Band: 0.094–0.1002 with near-term resistance at 0.098 and major support at 0.092. The near-term upside breakout target is 0.1019–0.1039 if DOGE closes above 0.10. Conversely, a break below 0.096 suggests a move toward 0.0941–0.0921. Market breadth is weak (<50%), and volatility regime is very low, indicating a subdued trading environment.
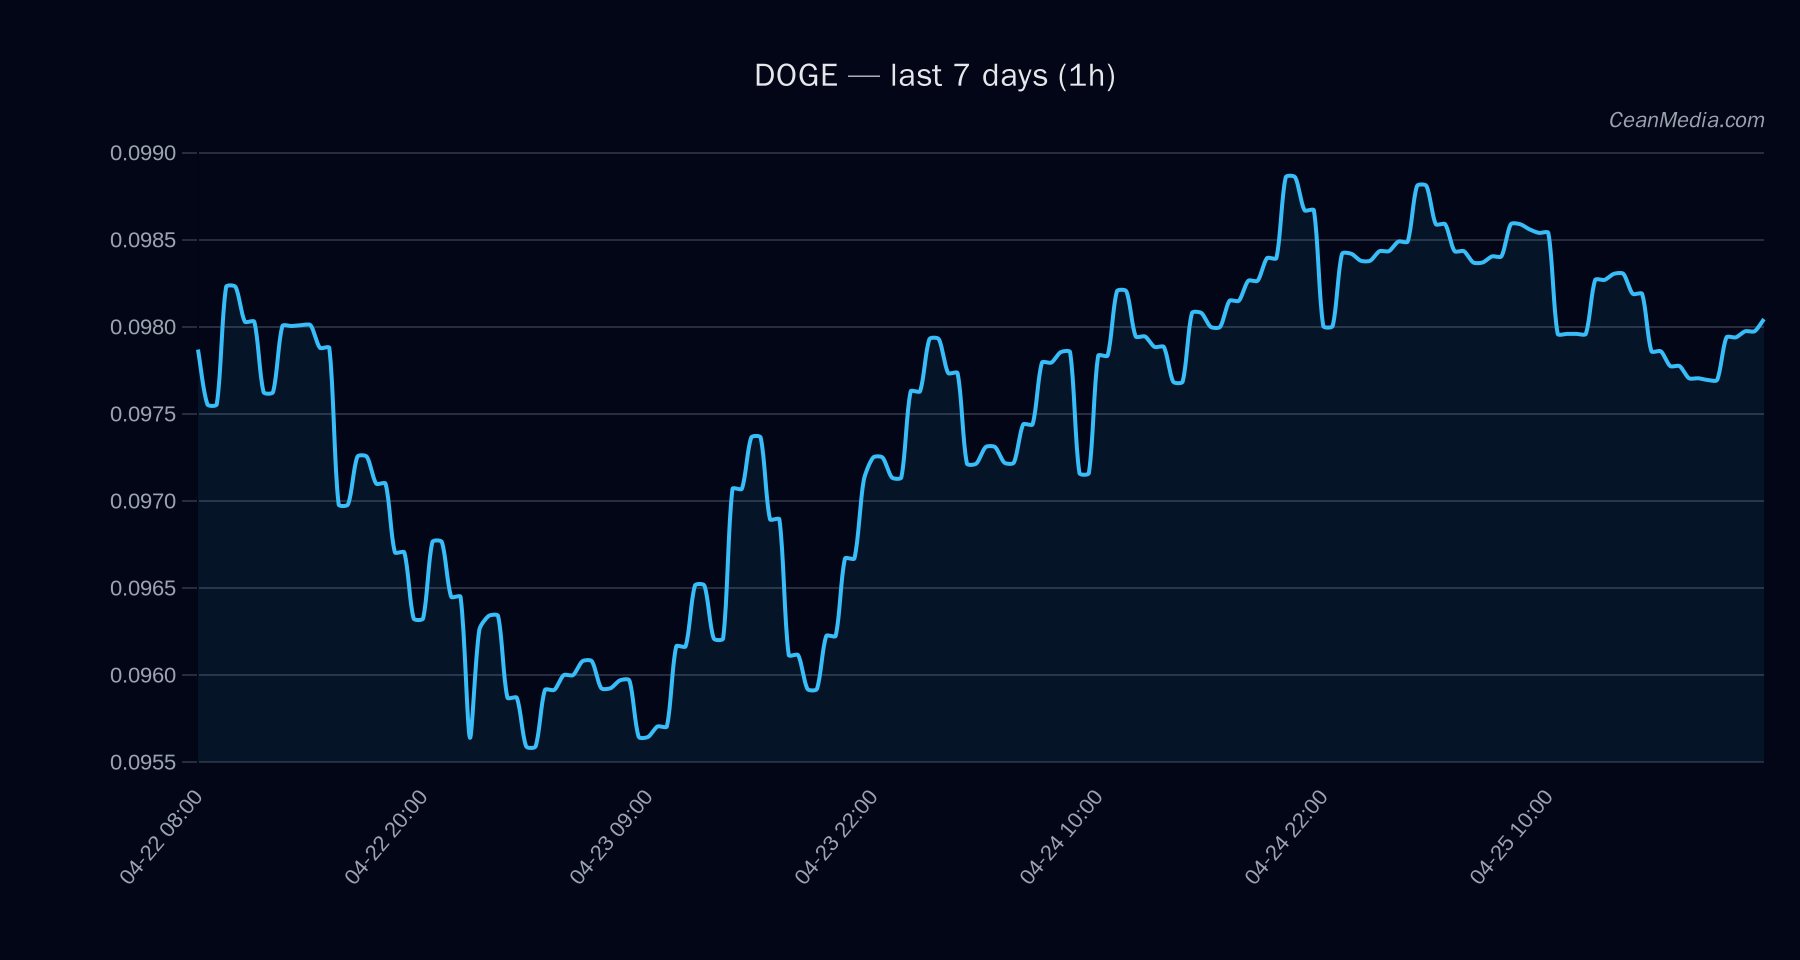
Technical Analysis: DOGE
Current setup: DOGE sits between the key support at 0.096 and resistance at 0.1. Trend indicators show EMA12 < EMA26 and SMA50 > SMA200, with RSI at 47, signaling neutral momentum and a sideways bias within a bullish-tinted range. Volatility (σ24h) at 0.21% reinforces a low-vol environment.
Levels to watch:
- Support (major): 0.092
- Support (near): 0.096
- Resistance (near): 0.10
- Resistance (major): 0.098
Bias and triggers:
- Bias: Upward bias intact on a close above 0.10.
- Upside trigger: 1h close > 0.1 targets 0.1019–0.1039.
- Downside trigger: 1h close < 0.096 targets 0.0941–0.0921.
Invalidation: Breakdown below 0.092 would weaken the technical setup further, while a sustained move above 0.103 could shift momentum more decisively upward.
Drivers
- Top drivers include a modest positive 24h return (0.0004) and EMA slope contributing to near-term upside.
- Funding and basis z-scores show mixed signals; funding z is positive, basis z is negative, indicating nuanced positioning rather than a clear directional edge.
- Order-book imbalance (EMA5) adds a small but notable tilt toward potential price support/resistance shifts.
- BTC 24h return is positive (0.0029) but BTC vol regime is described as negative, highlighting a contrast between DOGE’s local action and broader BTC-sided volatility.
- Overall volatility regime remains very low, aligning with the observed sideways tape and narrow bands.
ETF Flows (BTC/ETH)
Context: ETF flow data is provided for BTC and ETH (not DOGE). BTC ETF flows show a mixed signal: a small negative 1D flow (-$8.5M) with positive momentum over 5D and 10D horizons (+$363.9M and +$994.1M, respectively). ETH ETF flows display a similar pattern with negative 1D flow (-$2.3M) and positive longer-horizon accumulation (+$77.8M, +$300.6M). These figures represent broad risk-on/risk-off context in the larger crypto market, but they are not a primary signal for DOGE itself.
Interpretation: The BTC/ETH ETF flow backdrop suggests modest to constructive medium-term risk appetite in traditional crypto assets. While DOGE-specific signals remain bounded by local price action, the BTC/ETH flow regime can influence general market sentiment, liquidity conditions, and cross-asset correlations during periods of risk-on or risk-off dynamics.
What to Watch Next
- Close above 0.10 to sustain upside momentum toward 0.1019–0.1039.
- Monitor for a break below 0.096 that could expose 0.0941–0.0921.
- Observe shifts in BTC/ETH ETF flow trends as potential risk-on/off catalysts for the broader crypto complex.
- Watch for changes in volatility regime; a move away from very low volatility could precede a directional breakout.
Hashtags: #DOGE #CryptoAnalysis #TechnicalAnalysis #ETFFlows #BTC #ETH #MarketSnapshot #PriceAction #Momentum #RiskOn #MarketTrends