Market Snapshot
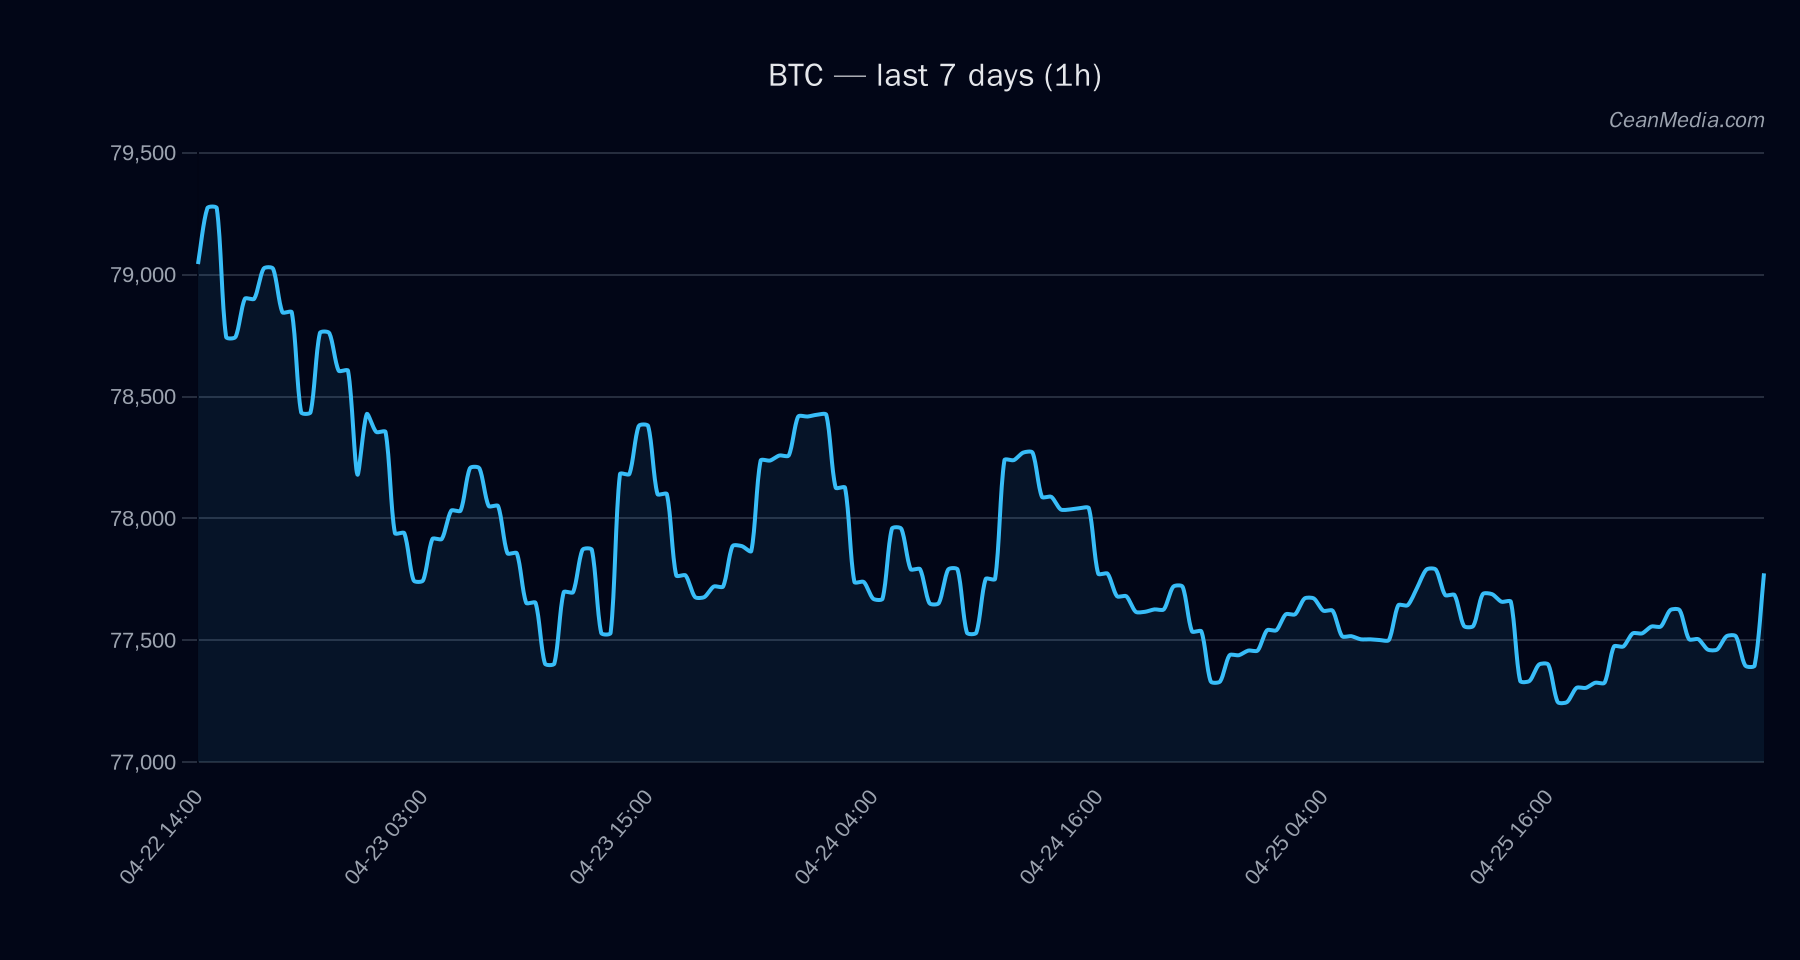
BTC is trading around the mid-to-upper range of its near-term band, with a current price of approximately 77,776.59. The market sits between a major support level of 74,050 and a major resistance level of 77,900, with a nearby resistance at 79,325 and a nearby support at 76,225. The short-term forecast indicates a directional tilt to the upside (49% probability), while the current volatility regime is described as Very low and the RSI sits at 57, indicating neutral momentum for now.
Key levels to watch: break above 79,325 targets 80,918.76 to 82,505.41; break below 76,225 opens a path to 74,696.64 and 73,172.22.
Technical Analysis: BTC
Support 74,050; Near-term Support 76,225; Resistance Major 77,900; Near-term Resistance 79,325. If 1h close > 79,325 → 80,918.76 to 82,505.41. If 1h close < 76,225 → 74,696.64 to 73,172.22. Price oscillates within the band P20–P80 of 74,886 to 80,221; P50 at ~77,903. The P50 price aligns closely with current levels, implying a balanced near-term risk/reward. LS GLOBAL Z-SCORE, SPREAD Z-SCORE, DEPTH Z-SCORE and VOL REGIME contribute to current read; BTC_TREND_STRENGTH indicates modest momentum support.
Drivers
RETURN 24H, EMA SLOPE, FUNDING Z-SCORE, BASIS Z-SCORE, OBI EMA5, BTC RETURN 24H. VOL REGIME described as Very low; TREND STRENGTH shows moderate positive momentum around 0.50; 7-day RV shows low correlation (0.017) to longer trends.
ETF Flows (BTC/ETH)
Context note: ETF flow data is provided for BTC and ETH only and is intended as a contextual backdrop rather than a primary signal for BTC price action. The data shows net inflows across recent observations, with BTC ETF flows contributing roughly +$14.4M in 1D, +$386.8M in 5D, and +$1.02B in 10D; ETH inflows are +$22.3M (1D), +$102.4M (5D), and +$325.2M (10D). These indicators suggest rising institutional interest in BTC and ETH ETFs, which can reflect broader risk-on sentiment but should not be treated as a standalone predictive signal for BTC price movements.
1D +$14.4M; 5D +$386.8M; 10D +$1.02B. 1D +$22.3M; 5D +$102.4M; 10D +$325.2M.
What to Watch Next
- Watch for a close above 79,325 to validate upside continuation toward 80,918.76–82,505.41.
- Monitor a break below 76,225 to assess downside risk toward 74,696.64 and 73,172.22.
- Observe ETF flow dynamics as a supplementary context for market risk appetite, especially BTC/ETH trends over the next 5–10 days.
- Keep an eye on volatility regime signals; a shift from Very low could accompany a broader directional move.
Hashtags: #Bitcoin #BTC #CryptoMarkets #TradingStrategy #ETFFlows #MarketAnalysis #TechnicalAnalysis #PriceAction #RiskManagement #CryptoETF #InstitutionalFlow #MarketContext