Market Snapshot
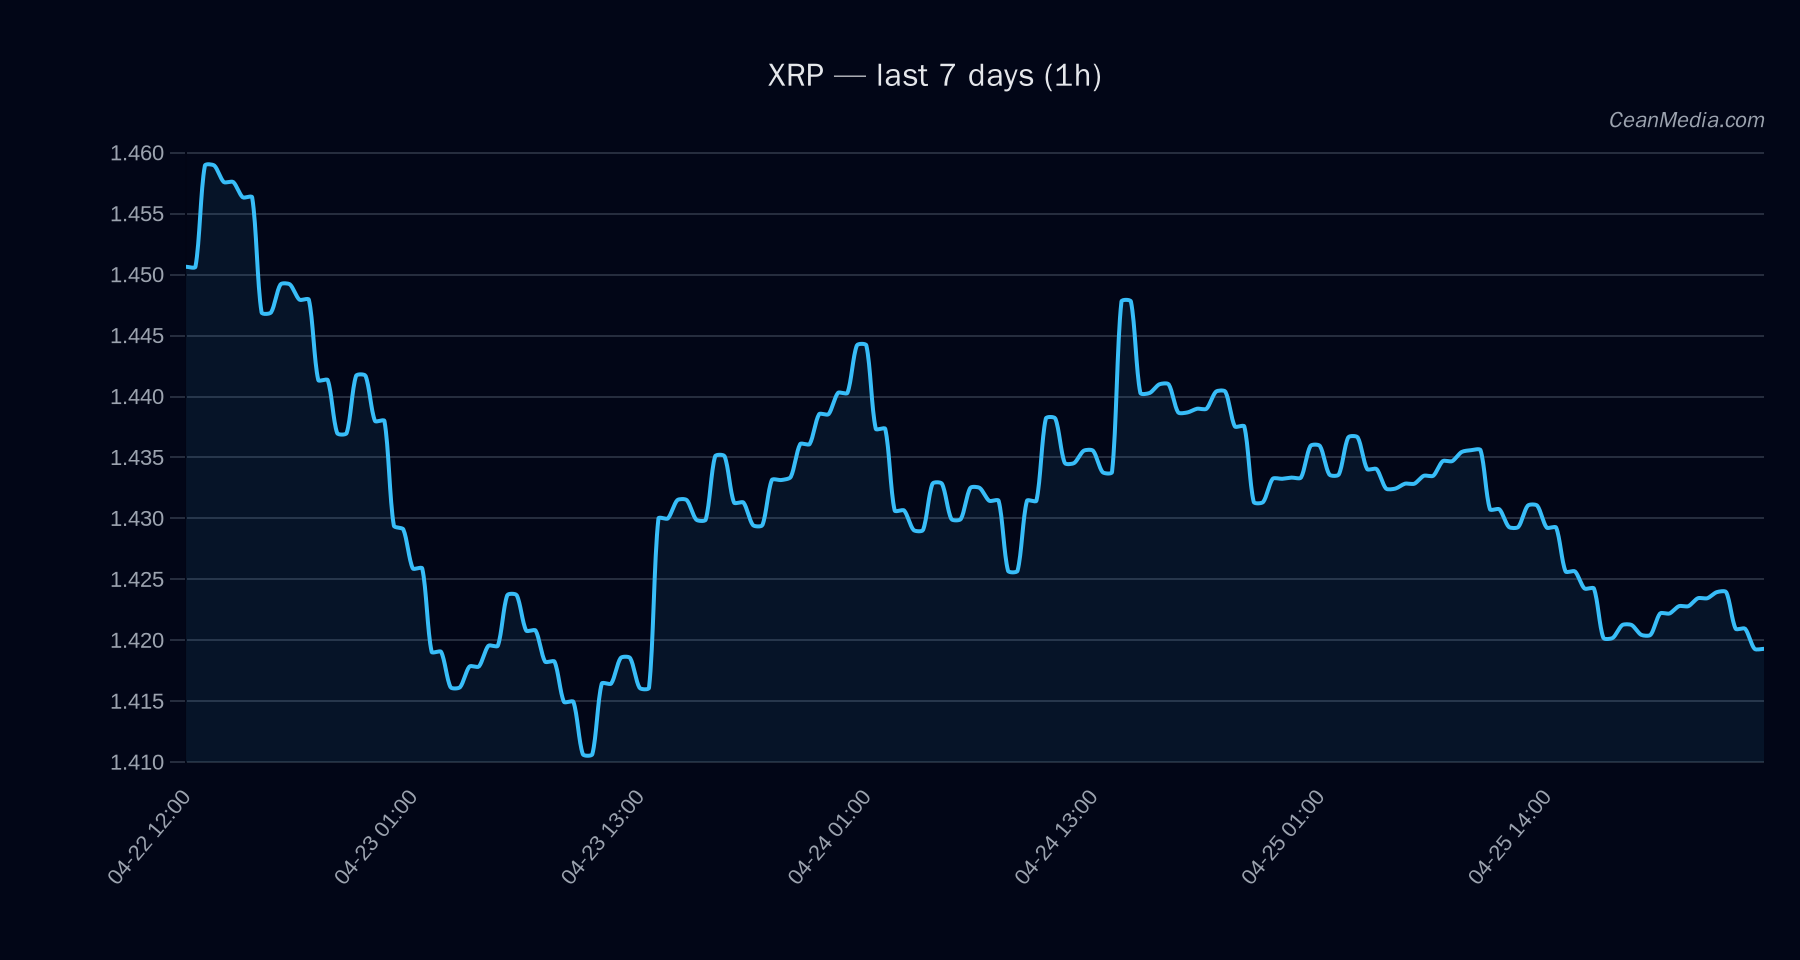
On 2026-04-26, XRP trades around 1.4215 with near-term bullish bias implied by the forecast. The price remains within a tight range between the major support at 1.34 and the near-term resistance at 1.44. Market breadth is subdued with a very low volatility regime, and the RSI sits at 38, signaling room for upside but currently lacking momentum. ETF flow data cited below provides broader market context but is not the primary signal for XRP price action.
Technical Analysis: XRP
1.4215 Up (probability ~45%) P20–P80 = 1.3735 – 1.4244 - Upside trigger: Break > 1.44 → potential move toward 1.4789–1.5079
- Downside trigger: Break < 1.4 → potential move toward 1.3652–1.3373
Very low TBI Z-SCORE, EMA slopes, position of spreads, and RV signals along with liquidity indicators; overall momentum modest with downside tilt from certain factors despite the 45% Up forecast.
Drivers
TBI Z-SCORE (contrib 1.74, value -3.76), TBI EMA10 (contrib -1.69, value -3.59), SPREAD BP (contrib -1.46, value -2.79), RV 7D (contrib 1.17, value -1.53), BTC RV 24H (contrib -0.66, value -1.44). Volatility of volatility and liquidity indicators show muted activity; distance from MA is small (value -0.0079), suggesting limited directional momentum in the immediate term. Trend strength score around 1.66 with BTC trend interactions (ρ(BTC,72h) ~0.73) indicating some positive correlation with broader crypto strength, but ETF data added below can temper expectations.
ETF Flows (BTC/ETH)
The ETF flow data provided focuses on BTC and ETH rather than XRP. Net signals show: BTC ETFs recorded a 1D negative flow of -$8.5M, but 5D and 10D inflows of +$363.9M and +$994.1M respectively; ETH ETFs show -$2.3M for 1D with positive inflows over 5D and 10D ( +$77.8M and +$300.6M ).
Interpretation: The BTC/ETH ETF flows suggest a mixed risk-on/off backdrop over different horizons. The 1D outflow in BTC indicates near-term softness, while longer horizons show substantial inflows that may reflect broader capital rotation into crypto assets. This data is contextual and should not be treated as a primary signal for XRP; XRP-specific dynamics may diverge from BTC/ETH ETF movements.
What to Watch Next
- Watch for a daily close above 1.44 to invalidate the 1.4-support-based downside path and target 1.4789–1.5079.
- Monitor RSI momentum around 38–40 for signs of improving tilt with a break above 1.44 on increasing volume.
- Observe any shifts in EMA12/EMA26 relationship and SMA50/SMA200 alignment for confirmation of a trend change.
- Keep an eye on global BTC/ETH ETF flow momentum as context for risk appetite, while focusing XRP-specific levels for tradable signals.
Hashtags: #XRP #CryptoAnalysis #TechnicalAnalysis #ETFFlows #BTC #ETH #MarketContext #PriceAction #TradingStrategy #RiskManagement #Liquidity #Momentum
Note: ETF data presented here is BTC/ETH specific and serves as contextual market backdrop rather than a direct XRP signal.