Market Snapshot
Solana (SOL) is trading near key support and resistance with a cautious near-term bias. The asset shows a bearish TA backdrop despite a 54% short-term forecast for upward movement, reflecting mixed signals from momentum indicators and low volatility regimes.
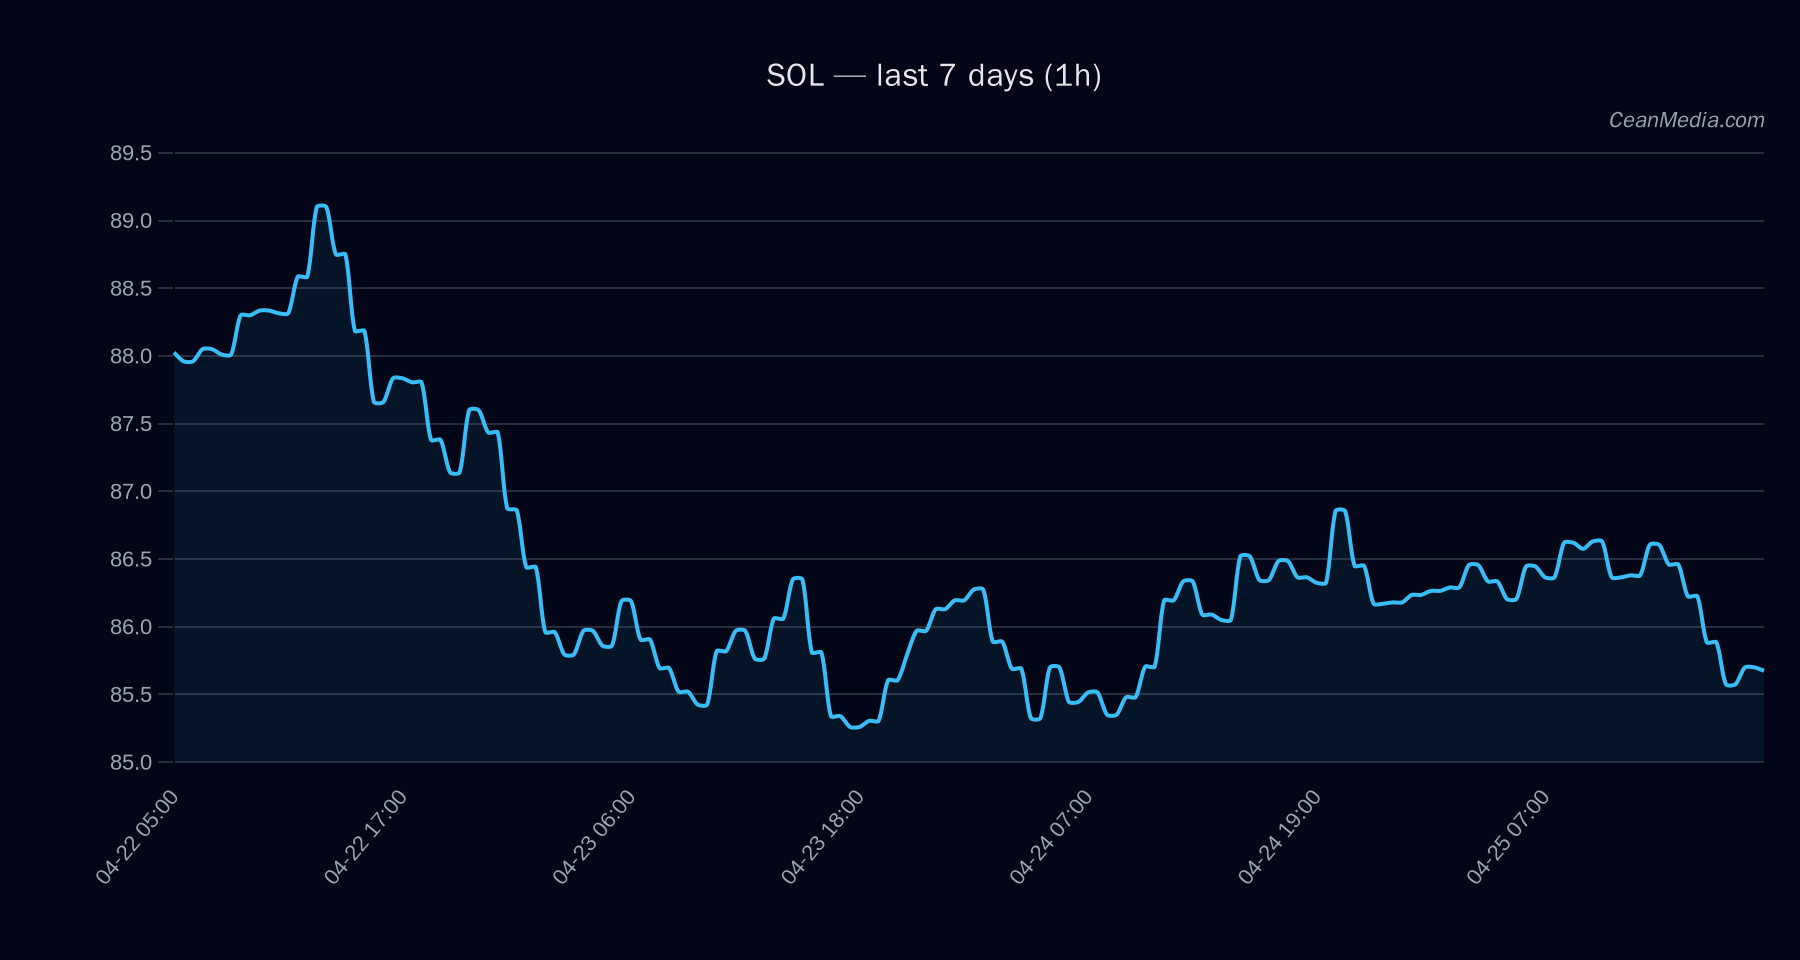
Technical Analysis: SOL
- Price: 85.8
- Current Range: Between major support 82.4 and near-term resistance 87.5.
- Key Levels:
- Support (Major): 82.4
- Support (Near): 84.1
- Resistance (Near): 87.5
- Resistance (Major): 88.0
- Forecast: Up with 54% probability for the next 24 hours (range 79.81–90.69 based on historical band).
- Bias & Indicators:
- EMA12 < EMA26 (bearish crossover)
- SMA50 < SMA200 (bearish)
- RSI: 42 (neutral to mildly bearish)
- Volatility regime: Very low
- Breakout Invalidation/Triggers:
- Upside trigger: 1h close > 87.5 → implied path to 89.27–91.02
- Downside invalidation: 1h close < 84.1 → implied path to 82.40–80.72
Drivers
- Top drivers show mixed contribution with a predominantly negative skew on z-scores for several traditional and cross-asset drivers.
- Notable signals:
- LS TOP Z-SCORE: -1.65 (value -2.34)
- LS GLOBAL Z-SCORE: 1.28 (value -2.05)
- BTC RV 24H: -0.66 (value -1.39)
- SPREAD Z-SCORE: 0.47 (value -4.49)
- RV 24H/7D: modest negative-to-neutral signals
- BTC VOL REGIME: negative imprint
- Overall momentum indicators point to a cautious stance, with low realized volatility and neutral RSI.
ETF Flows (BTC/ETH)
The provided ETF flow data covers BTC and ETH only. BTC ETF flows show a notable intraday negative move (-$8.5M) with five- and ten-day cumulative inflows (+$363.9M and +$994.1M, respectively). ETH ETF data show a smaller intraday negative move (-$2.3M) with positive multi-day inflows (+$77.8M and +$300.6M).
Interpretation: ETF flow context is external to SOL and should be regarded as contextual, not a primary signal for SOL price action. The data can reflect broader risk-on/risk-off sentiment and capital reallocation tendencies between BTC/ETH and altcoins, but SOL’s immediate driver remains its own technical setup and micro-market dynamics.
What to Watch Next
- Monitor for a close above 87.5 to sustain upside projection toward the 89.27–91.02 zone.
- Watch for a daily close below 84.1 as a early sign of potential leg lower toward 82.40–80.72.
- Observe changes in volatility regime; a shift from very low to higher regime could precede a breakout or retracement.
- Keep an eye on BTC/ETH ETF flows as ambient risk sentiment may influence risk assets broadly, including SOL.
Hashtags: #SOL #Solana #CryptoTrading #BTC #ETH #ETFFlows #MarketAnalysis #TechnicalAnalysis #CryptoNews #Altcoins #Momentum #Liquidity
Disclaimer
ETF data presented here refers exclusively to BTC and ETH flows and is provided for context. It is not a primary trading signal for SOL.