Market Snapshot
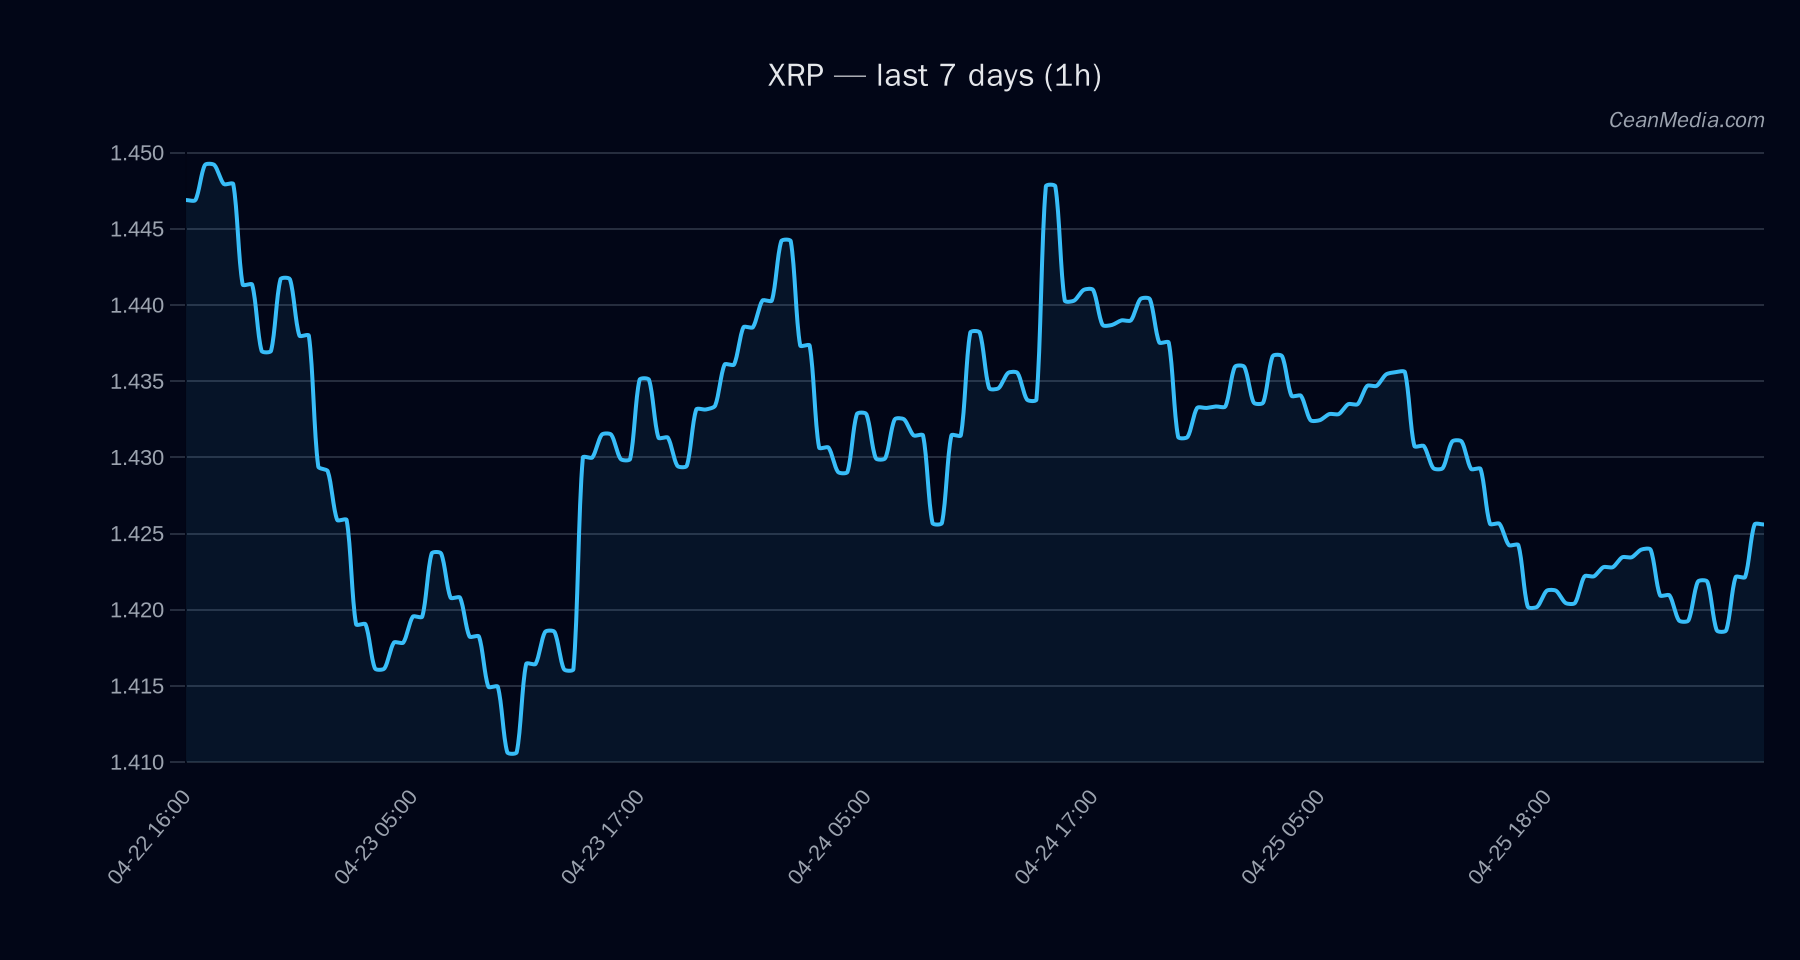
On 2026-04-26, XRP trades around 1.43 with a near-term bias of upside probability (~50%). The price sits between a major support at 1.34 and a near-term resistance at 1.46. The current band (P20–P80) spans 1.41 to 1.4509, with a slightly bullish drift implied by the forecast, but a very low volatility regime is noted (σ24h 0.16%). Momentum indicators show a neutral RSI of 51, and the moving-average structure indicates a bearish cross (EMA12 < EMA26, SMA50 < SMA200).
Technical Analysis: XRP
- Support (Major): 1.34
- Support (Near): 1.40
- Resistance (Near): 1.46
- Resistance (Major): 1.44
- Upside trigger: close > 1.46 targets 1.4843–1.5134
- Downside trigger: close < 1.40 targets 1.3702–1.3422
Drivers
Return 24h (-0.48%), EMA slope (small positive), Funding Z-Score (-1.48), Basis Z-Score (-0.05), OBI EMA5 (0.04), BTC Return 24h (+0.60%). BTC volatility regime negative, Vol Regime: Very low, Vol of Vol small (0.46% contribution in the model context). Trend strength remains modest (0.60 range). Spread BP shows a slight positive contribution; Spread Z-Score near neutral (0.007). Overall, top drivers present a mixed picture with light net directional tilt.
ETF Flows (BTC/ETH)
The ETF flow context provided focuses on BTC and ETH rather than XRP. BTC ETFs show positive net flows: +$14.4M (1D), +$386.8M (5D), and +$1.02B (10D). ETH ETFs show +$22.3M (1D), +$102.4M (5D), and +$325.2M (10D). These figures indicate a generally supportive environment for risk-on activity via large-cap crypto exposure, which can indirectly influence XRP sentiment through broader market breadth and liquidity dynamics. It is important to note that ETF data is BTC/ETH-centric and should be interpreted as context rather than a primary signal for XRP trading decisions.
What to Watch Next
- Watch for a close above 1.46 to confirm a bullish extension toward 1.4843–1.5134.
- Consider risk management around a break below 1.40, which could open a path toward 1.3422–1.3702.
- Monitor BTC ETF flow dynamics and overall crypto risk-on/off sentiment as a backdrop for XRP liquidity and risk appetite.
- Keep an eye on volatility regime changes; a shift from Very low to higher regimes may precede larger intraday moves.
Hashtags: #XRP #CryptoAnalysis #TechnicalAnalysis #ETFFlows #BTC #ETH #MarketOutlook #RiskOn #PriceAction #Liquidity #Momentum #Volatility