Market Snapshot
As of the latest close, XRP trades near a pivotal zone between support at 1.40 and resistance at 1.46. The short-term trajectory signals a modest up bias with probabilities around 51% for an upside move over the near term. Market breadth metrics show broad participation indicators elevated (Breadth>50h at 100%), while volatility remains in a very low regime. The macro context includes a BTC/ETH ETF flow backdrop in positive territory, which provides background liquidity support but should not be treated as a primary XRP signal.
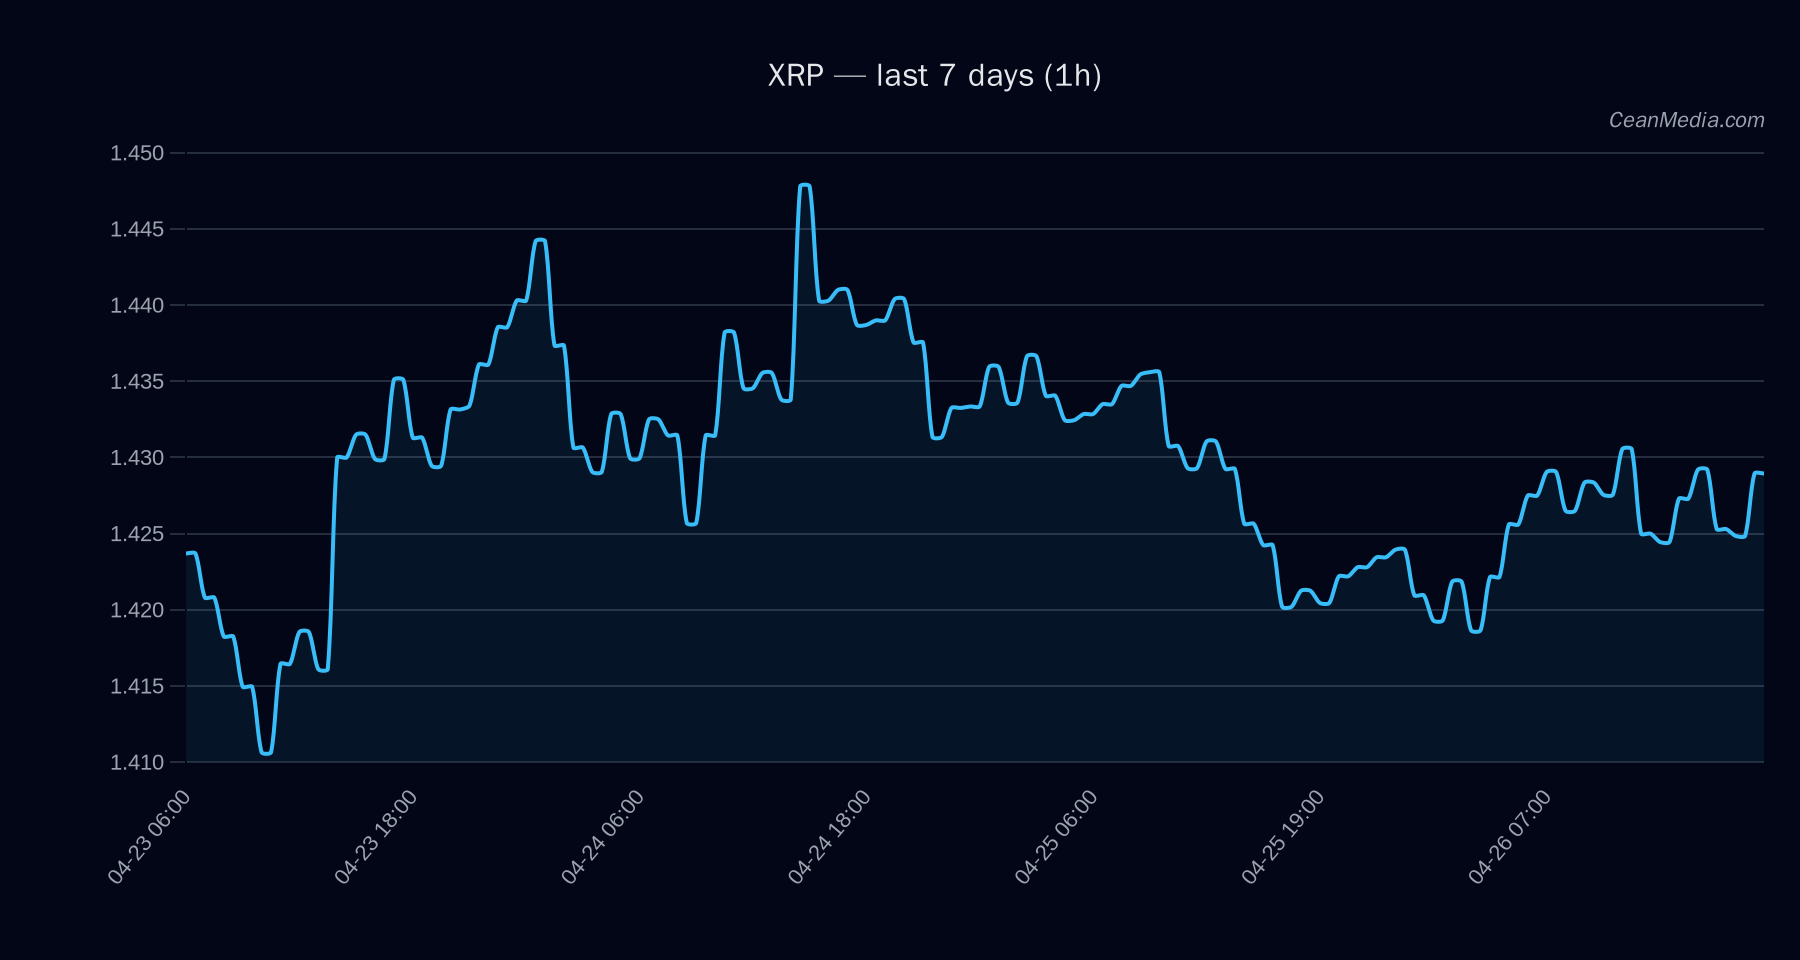
Technical Analysis: XRP
- Current Price: 1.4311
- Short-Term Forecast: Up (51%)
- Key Indicators: EMA12>EMA26, SMA50
- Band: P20–P80 1.4172 — 1.4616
- Support: Major 1.34, Near 1.40
- Resistance: Major 1.44, Near 1.46
- Upside Trigger: 1h close > 1.46 targets 1.4889 — 1.5181
- Downside Trigger: 1h close < 1.40 targets 1.3744 — 1.3464
- Bias: Upside (conditional on break of 1.46), otherwise sideways near current range
- Invalidation: Break below 1.40 weakens near-term upside setup
Drivers
RETURN 24H, EMA SLOPE, FUNDING Z-SCORE, BASIS Z-SCORE Vol regime remains very low; volatility of volatility modest; trend strengths modest BTC trend strength positive (BTC RV 24H), BTC returns modestly up, with 72h BTC/market correlation around 0.70 Order-book imbalance and SPREAD metrics show mixed signals; LIQ IMB EMA12 provides a modest positive read
ETF Flows (BTC/ETH)
Contextual note: ETF data shown here is limited to BTC and ETH and is not a primary signal for XRP. However, these flows influence overall market liquidity and risk sentiment. BTC and ETH ETFs are registering net inflows in the near term, aligning with a constructive liquidity backdrop and potential risk-on tilt, which can indirectly support broader crypto risk assets.
- BTC ETF: 1D +$14.4M, 5D +$386.8M, 10D +$1.02B
- ETH ETF: 1D +$22.3M, 5D +$102.4M, 10D +$325.2M
What to Watch Next
- Watch for a daily close above 1.46 to validate the upside target range of 1.4889–1.5181.
- A break below 1.40 would shift focus toward the 1.3744–1.3464 downside area.
- Monitor BTC/ETH ETF inflows as a contextual liquidity proxy, recognizing they are not XRP-specific signals.
- Observe RSI around neutral levels and volatility regime for any shift that could precede a breakout or breakdown.
Hashtags: #XRP #CryptoAnalysis #TechnicalAnalysis #ETFFlows #BTC #ETH #MarketSnapshot #Liquidity #CryptoRiskOn #PriceAction #Momentum #USD