Market Snapshot
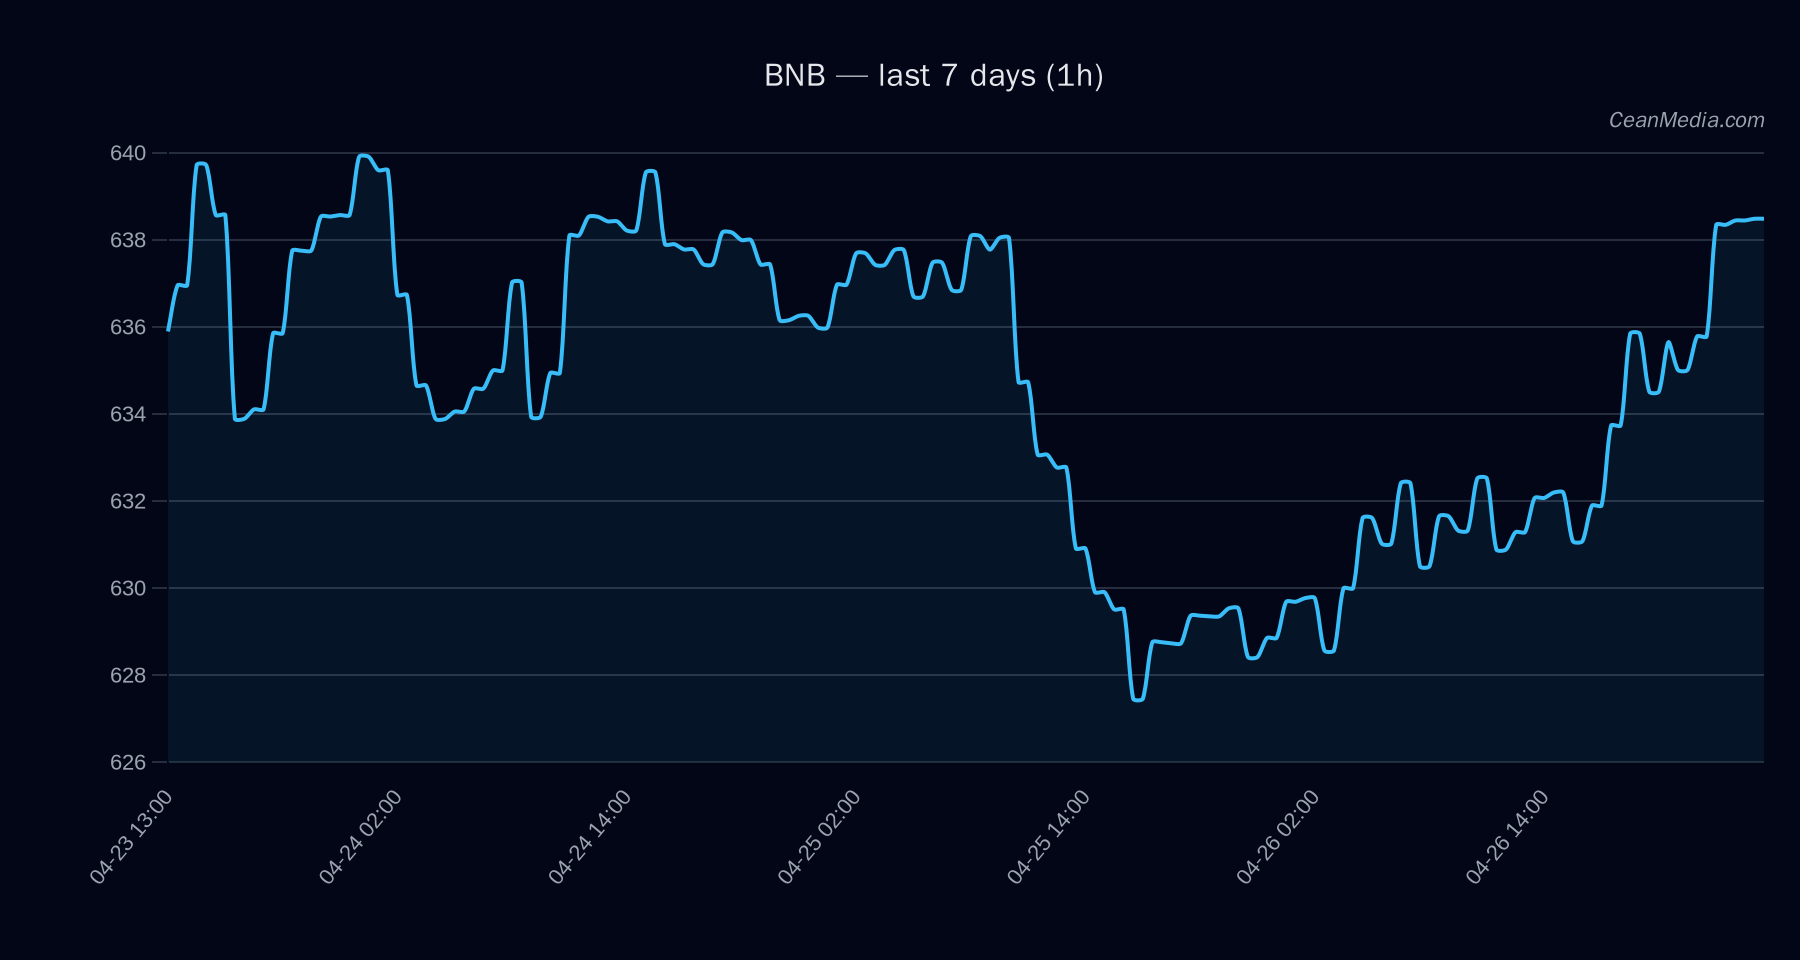
BNB price is trading around 639.61 with a short-term forecast leaning down (66%). The near-term levels place major support at 609 and near-term support at 627, while resistance sits at 640 (major) and 652 (near). The current context shows a low volatility regime with RSI at 70 and EMA/MA alignment suggesting a bearish signal in the immediate horizon. Broader breadth indicators remain constructive (>50h breadth at 100%), but the price action is constrained within the 627–652 range pending a breakout.
Technical Analysis: BNB
- Current Price: 639.61
- Bias / Forecast: Downwards bias (66% probability) in the next period
- Key Levels:
- Support: Major 609, Near 627
- Resistance: Major 640, Near 652
- Breakout Scenarios:
- Upside trigger: 1h close > 652 → potential move to 665.45 – 678.50
- Downside trigger: 1h close < 627 → potential move to 614.28 – 601.75
- Indicators:
- EMA12 > EMA26
- SMA50 > SMA200
- RSI ≈ 70 (overbought territory)
- Volatility regime: Very low
- σ24h: 0.19%
- Invalidation / Notes: Short-term bearish tilt remains valid unless price clears 652 on a close, which would shift the setup toward a bullish resumption if accompanied by sustained buying above the near-term resistance.
Drivers
- Top drivers include EMA12 slope, depth-related metrics, and basis/borrowing signals.
- Momentum / Volatility: Very low volatility, with a bullish/optimistic drift in some moving-average metrics despite the down forecast.
- Key contributions:
- LIQ IMB EMA12: positive contribution
- DEPTH USD 10BP LOG1P: supportive
- BASIS Z-SCORE: positive contribution
- SPREAD Z-SCORE: negative contribution (watch for spread dynamics)
- RV 24H: modest negative impact
ETF Flows (BTC/ETH)
Contextual ETF flow data is provided for BTC and ETH only. Recent data show BTC ETF inflows of +$14.4M on 1D, +$386.8M on 5D, and +$1.02B on 10D; ETH ETF inflows are +$22.3M on 1D, +$102.4M on 5D, and +$325.2M on 10D. These figures serve as market context and are not primary signals for BNB pricing. The flows indicate a risk-on stance in broader crypto markets, which can support correlated assets but should be weighed against BNB-specific technicals and fundamentals.
What to Watch Next
- Monitor for a close above 652 to validate a potential breakout scenario toward 665–678.
- Watch for a break below 627 for downside extension toward 614–602 range.
- Observe changes in volatility regime and RSI behavior near 70–75 to assess reactive momentum shifts.
- Keep an eye on BTC/ETH ETF flows as context for risk appetite, without treating them as a direct signal for BNB.
Hashtags: #BNB #CryptoMarket #TechnicalAnalysis #ETFFlows #BTC #ETH #TradingStrategy #MarketSnapshot #CryptoNews
Note: ETF data provided here is strictly BTC/ETH and is intended for contextual risk assessment rather than direct signal generation for BNB trades.