Market Snapshot
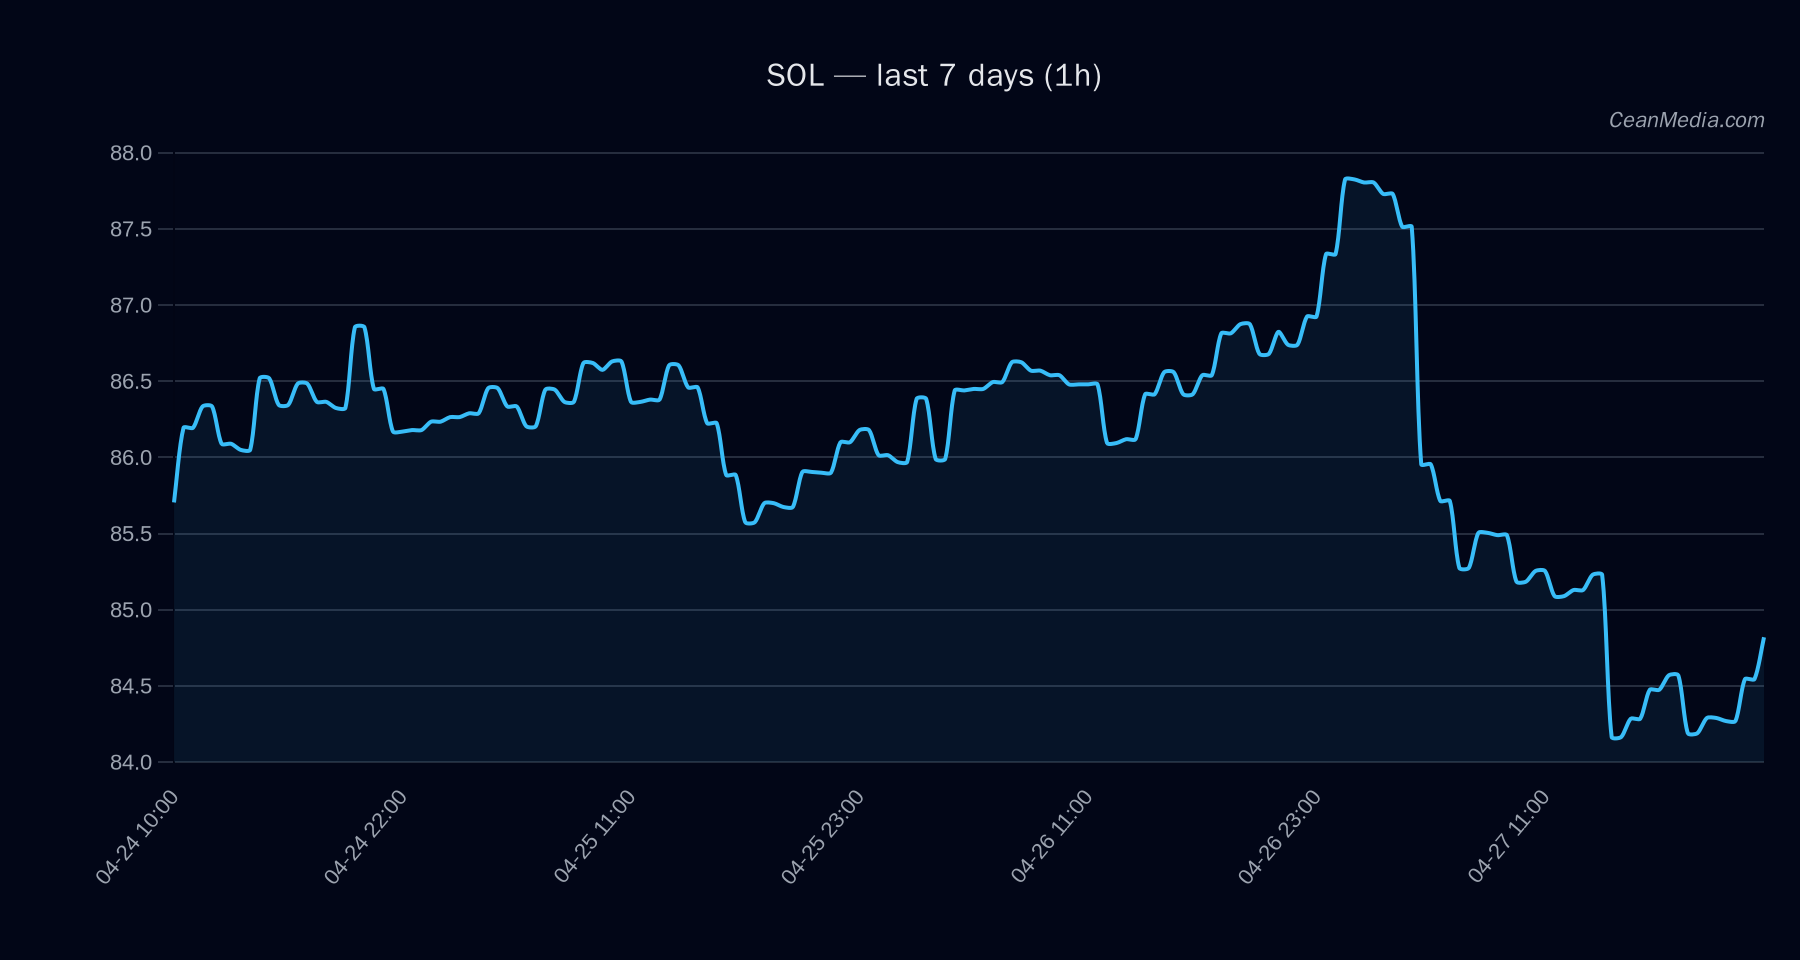
On 2026-04-28, SOL trades around the mid-80s zone with a price of approximately 84.75. The short-term forecast leans towards an upside bias (47% probability of rising), while near-term downside risk remains notable (41%). Technical indicators show EMA12 < EMA26, SMA50 < SMA200, and RSI at 42, with a very low 24h volatility regime. The immediate support is 83.1–83.2 and resistance around 86.4, with a potential upside breakout to ~88.17–89.90 if the 1h close exceeds 86.4. Conversely, a break below 83.1 could target ~81.39–79.73.
Technical Analysis: SOL
Support 83.1 (major near 83.1), Resistance 86.4 (near 86.4); breach of 86.4 targets 88.17–89.90; breach of 83.1 targets 81.39–79.73. RSI 42; σ24h 0.51% (very low volatility); Vol regime: Very low; Breadth measures currently weak (Breadth>50h: 0%). Break above 86.4 (invalidating bearish near-term bias) would imply potential move toward 88.17–89.90. Break below 83.1 would invalidate the upside setup and point toward 81.39–79.73.
Drivers
LS TOP Z-SCORE (contrib 3.96; value 4.1) supports upside pressure; LS GLOBAL Z-SCORE (contrib -3.45; value 3.45) weighs on momentum; LS GLOBAL DELTA 24H (contrib 1.16; value 2.59) modestly supportive; TOP DELTA 24H (contrib -0.83; value 2.92) mixed signals. TBI EMA10 (contrib 0.48; value -4.98) dampens near-term momentum; TBI Z-SCORE (contrib -0.45; value -6.35) indicating negative tilt; trend_strength high (value 0.95). BTC-related metrics show 72h correlation 0.85 and BTC trend strength positive, with BTC.D at 58.1% daily. σ24h is low; vol regime = very low, suggesting subdued price swings and potential for range-bound action until a breakout. Funding Z-SCORE and Basis Z-SCORE have mixed reads, with funding at slightly negative pressure.
ETF Flows (BTC/ETH)
Contextual data show ETF flows for BTC and ETH as follows: BTC ETF +$14.4M 1D, +$386.8M 5D, +$1.02B 10D; ETH ETF +$22.3M 1D, +$102.4M 5D, +$325.2M 10D. These figures reflect risk-on/risk-off sentiment in the broader crypto market but are not a primary signal for SOL. The data should be interpreted as corroborative context rather than a direct SOL signal.
What to Watch Next
- Watch for a 1h close above 86.4 to validate the upside breakout toward 88.17–89.90.
- Monitor a break below 83.1 for potential move toward 81.39–79.73; reassess risk management if price enters the 82–84 zone.
- Keep an eye on volatility regime; a shift from very low to higher volatility could precede larger moves, especially if macro or BTC-driven flows intensify.
- Consider the ETF flow context as ancillary: BTC/ETH inflows can signal broader market risk appetite but should not be used in isolation to act on SOL positions.
Hashtags: #SOLAnalysis #SOLPrice #CryptoMarket #ETFFlows #BTC #ETH #TechnicalAnalysis #TradingSignals #RiskManagement #CryptoNews
Notes
Assessed data reflect the cross-sectional snapshot as of 2026-04-28 and include top drivers, momentum indicators, and ETF flow context limited to BTC/ETH. The ETF data is context-only and not a primary SOL signal.