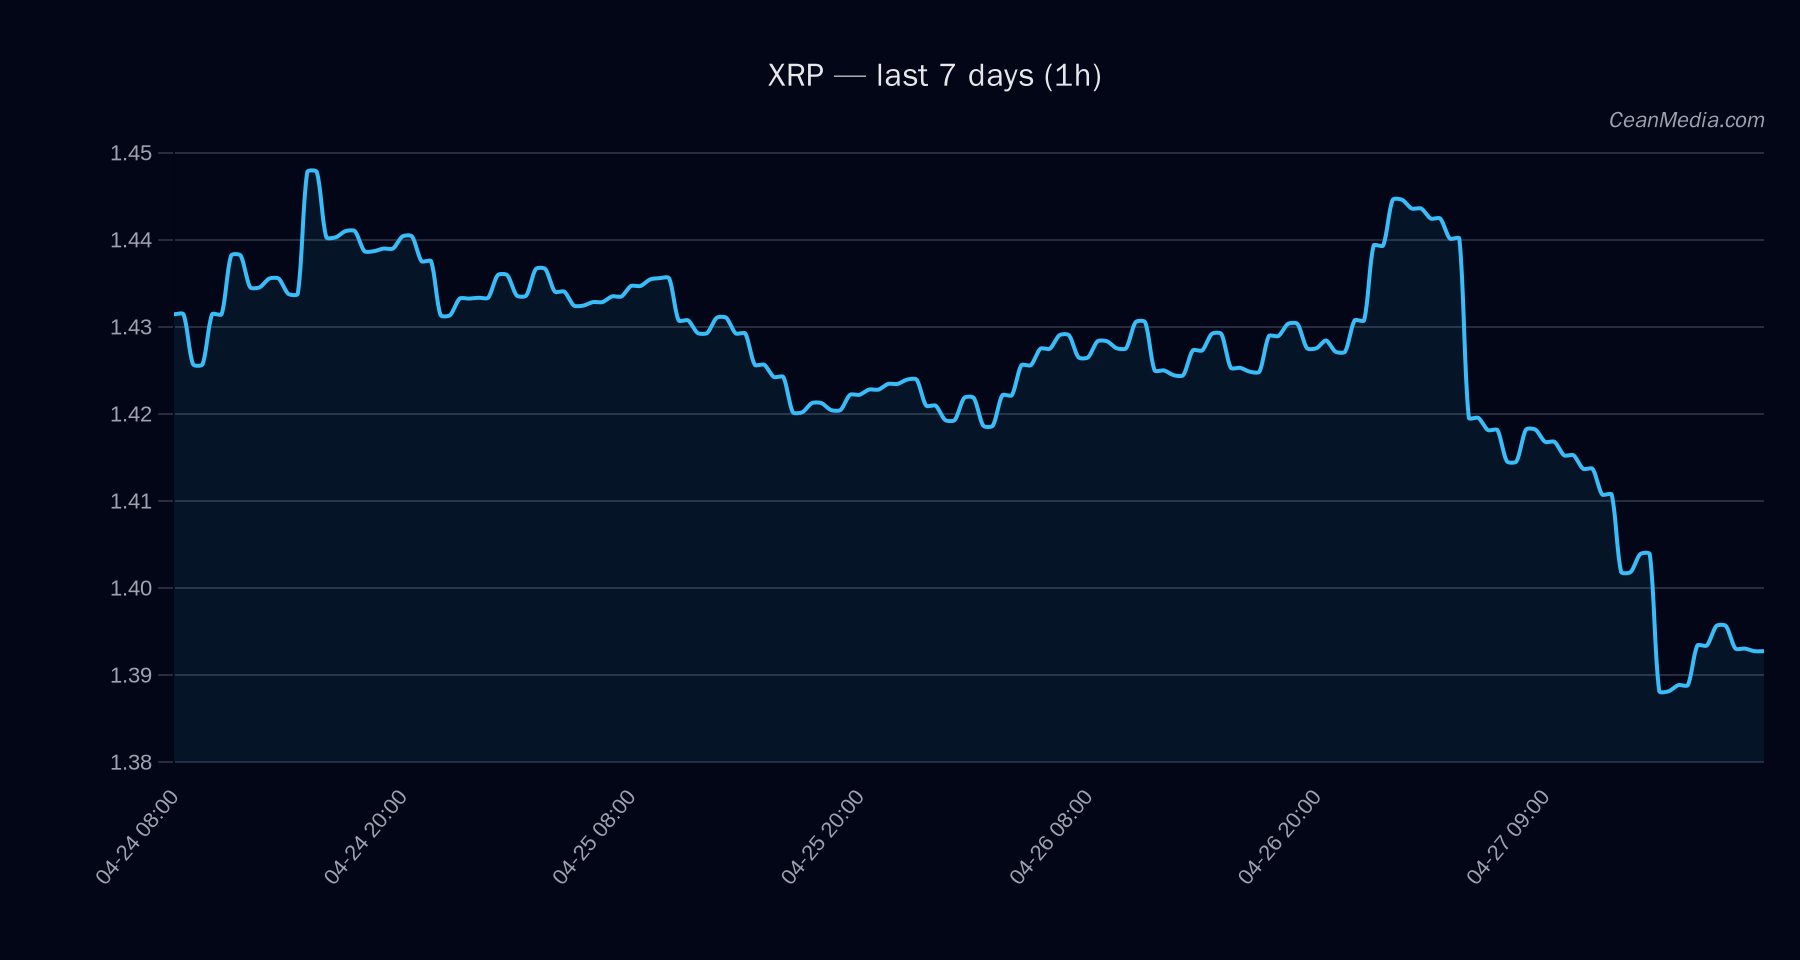
Market Snapshot
On 2026-04-27, XRP traded around 1.39 with a short-term bias toward the upside. The price remains within a defined range anchored by support near 1.34–1.36 and resistance around 1.42–1.44. Market breadth indicators show subdued momentum, with volatility in the very low regime and RSI around 30, indicating potential oversold conditions that could precede a relief rally if price breaks above nearby resistance.
Technical Analysis: XRP
- Current price (reference): 1.3915
- Short-term forecast: Up (probability ~45%)
- Key levels:
- Major Support: 1.34
- Near Support: 1.36
- Major Resistance: 1.44
- Near Resistance: 1.42
- Trade triggers:
- Upside trigger: 1h close > 1.42 → potential move to 1.4477–1.4761
- Downside trigger: 1h close < 1.36 → potential move to 1.3364–1.3091
- Bias and momentum: EMA12 < EMA26, SMA50 < SMA200 indicate a bearish trend within the context of a potential short-term rebound; RSI at 30 suggests oversold conditions, though overall vol regime is very low.
- Volatility: 24h sigma ~0.43%, very low regime
Forecast interpretation: While the baseline model signals a modest upside probability, the TA picture emphasizes a cautious stance given the bearish crossovers and low volatility environment. A decisive close above 1.42 would improve bullish confirmation; a break below 1.36 would widen the downside range.
Drivers
- Top drivers include liquidity-to-open interest (positive), trend-basis signals (mixed) and intraday order-book effects.
- Key contributors show a net skew toward bearish signals from funding and basis metrics, with some support emerging from short-term EMA dynamics and order-book balance.
- Overall momentum appears restrained, with trend strength modest and distance-from-MA near break-even. Volatility-driven factors are muted in the current regime.
ETF Flows (BTC/ETH)
Context: ETF flow data provided pertains to BTC and ETH only. These signals should be viewed as macro-market context rather than primary signals for XRP. Recent daily ETF flows show bullish moves for BTC and ETH across 1D, 5D, and 10D horizons, suggesting appetite for risk-on assets in the broader crypto market. While XRP does not trade as an ETF, these flows can influence risk sentiment and correlated assets.
- BTC ETF: 1D +$14.4M, 5D +$386.8M, 10D +$1.02B
- ETH ETF: 1D +$22.3M, 5D +$102.4M, 10D +$325.2M
What to Watch Next
- Watch for a breakout above 1.42 on a sustained close to validate the upside range extension toward 1.4477–1.4761.
- Monitor for a break below 1.36 with close protection; anticipate potential move toward 1.3364–1.3091.
- Observe changes in RSI and volatility regime; a rising RSI away from 30 could indicate improving breadth for gains.
- Consider broader BTC/ETH ETF flow shifts for sentiment cues, while recognizing XRP-specific signals remain primary for XRP trades.
Hashtags: #XRP #crypto #technicalanalysis #ETFFlows #BTC #ETH #marketoutlook #trading2026 #riskmanagement #liquidity #volatility