Market Snapshot
The primary asset analyzed is Cardano (ADA) with a current price around 0.246 in the immediate vicinity of key support at 0.24 and resistance at 0.25. The near-term forecast assigns a 65% probability to upside movement, with an RSI indicating neutral conditions (around 44). Market breadth is subdued, and volatility is described as very low, consistent with a range-bound backdrop.
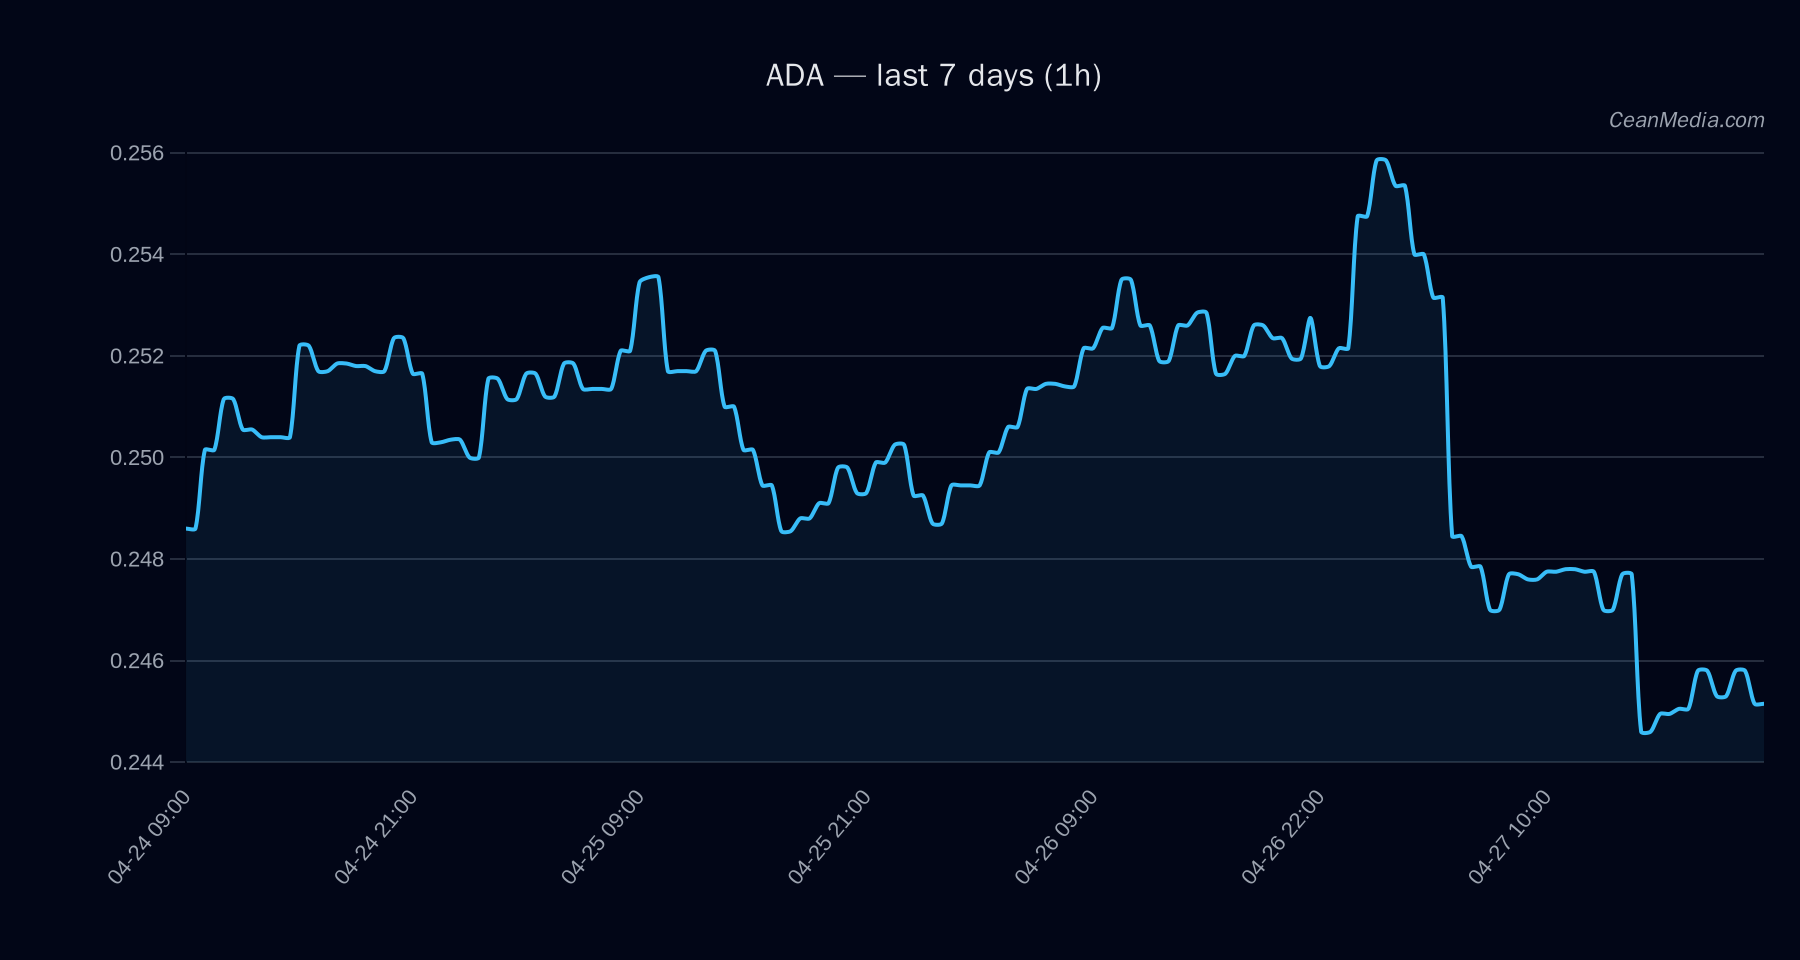
Technical Analysis: ADA
Price around 0.246; price is trading between the major support at 0.24 and the major resistance at 0.255. Upside breakout above 0.25 opens a path to 0.2569–0.2619; downside breakout below 0.24 targets 0.2371–0.2323. Forecast: Up (65%). TA shows sideways tendencies in the short term, with EMA12 < EMA26, SMA50 > SMA200, RSI at 44, and very low volatility (σ24h ≈ 0.56%). Support → Major: 0.24; Near: 0.24. Resistance → Major: 0.255; Near: 0.25. Trend-local targets depend on a break above/below the described levels. RSI neutral; momentum indicators show a cautious stance with room for a short-term move higher if bullish triggers occur.
Drivers
Key drivers include LIQ IMB EMA12, RV 7D, and funding/basis dynamics. Notable observations: – Funding Z-SCORE is negative, indicating funding pressure; – LIQ IMB Z-SCORE is negative, showing liquidity-im Balance concerns; – RV 7D is modestly positive, suggesting mixed timing signals. Trend strength readings are mixed but point to a cautious upshot, with a relatively low volatility regime. The distance from moving averages is near neutral to slightly negative, implying no strong breakout yet. The combination of indicators supports a cautious tilt toward upside, contingent on a price break above 0.25 and sustained momentum.
ETF Flows (BTC/ETH)
Context: ETF flow data is provided for BTC and ETH only. These figures are treated as contextual risk-on/risk-off signals and are not primary signals for ADA trading. The data shows inflows across both BTC and ETH ETFs, indicating renewed investor appetite in top-cap crypto exposure. This environment can influence overall market sentiment and liquidity but should not be over-weighted for ADA-specific decisions.
1D +$14.4M | 5D +$386.8M | 10D +$1.02B 1D +$22.3M | 5D +$102.4M | 10D +$325.2M
What to Watch Next
- Watch for a close above 0.25 to confirm upside continuation toward 0.2569–0.2619.
- Monitor 1h price action around 0.24 for early signs of a downside invalidation to 0.2371–0.2323.
- Keep an eye on liquidity-related indicators (LIQ IMB Z-SCORE, BASIS Z-SCORE) for signs of shifting balance.
- Track BTC/ETH ETF flow momentum for broader market risk sentiment, while maintaining ADA-specific risk controls.
Hashtags: #ADA #Cardano #CryptoAnalysis #MarketSnapshot #TechnicalAnalysis #ETFFlows #BTC #ETH #CryptoMarket #PriceAction #Liquidity #Momentum
Note: ETF data is provided for BTC and ETH only and is intended as contextual information to gauge broader market sentiment. It should not be treated as a primary signal for ADA trading decisions.