Market Snapshot
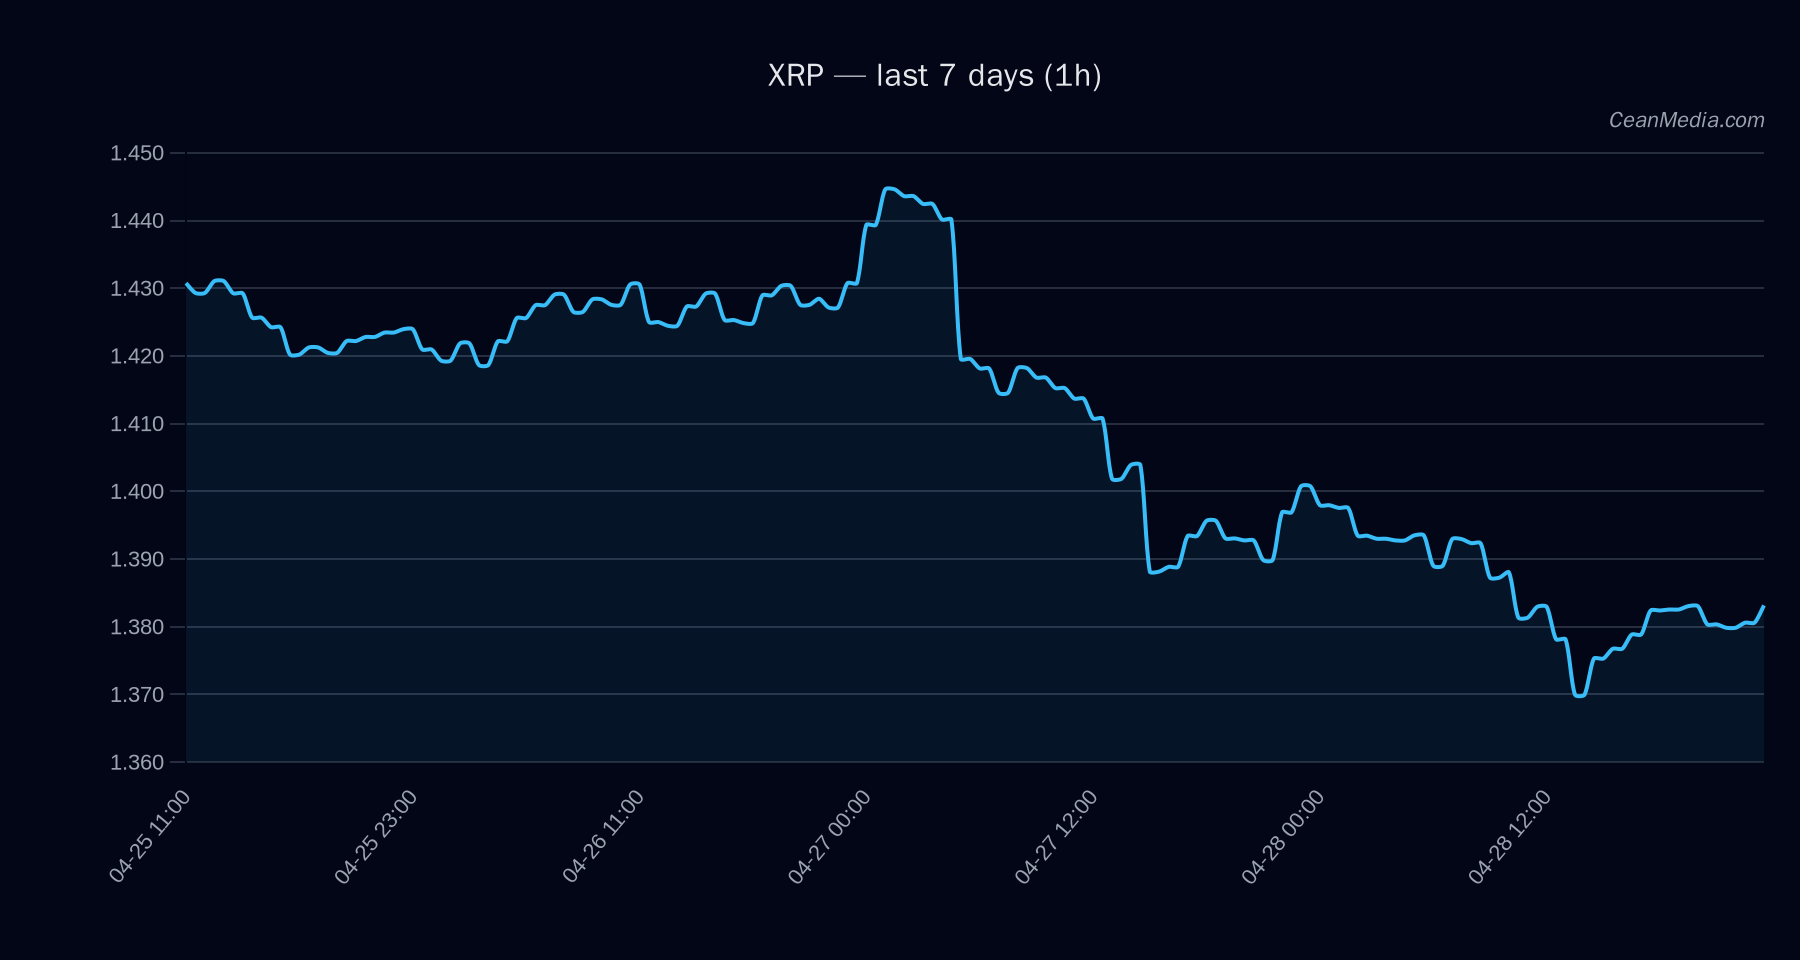
On 2026-04-29, XRP trades around the 1.38 area with a short-term forecast tilted modestly higher. The current pattern places price between key intraday support and resistance, with a bearish tilt suggested by several model inputs but a 47% probability of an upside move over the near term. The broader market signals indicate very low volatility and a cautious risk environment, with circulating ETF flows noted for BTC and ETH rather than XRP itself.
Technical Analysis: XRP
1.3803 up (47%) 1.318 – 1.4376 1.36 1.44 / 1.4 price remains within a tight band; downside trigger >1.36, upside trigger >1.4 EMA12 < EMA26, SMA50 < SMA200, RSI 40, Volatility (24h) 0.24%, Very low vol regime
Breakout/Invalidation levels:
a close above 1.4 targets 1.4361 – 1.4642 a close below 1.36 targets 1.3256 – 1.2986
Notes on context: The forecast is derived from a combination of trend, momentum, and order-flow signals. RSI sits at 40, indicating neutral momentum, while the “Vol regime: Very low” implies reduced market activity and potentially whippy moves around key price levels.
Drivers
- Top drivers include RV 7D, EMA slope (EMA10), Z-score measures, order-book imbalance (EMA5), and liquidity signals (LIQ IMB EMA12).
- Recent contributions show mixed signals: positive inputs from EMA slope and order-book imbalance contrast with negative signals from funding and basis z-scores.
- BTC-related inputs (BTC RV 24H, BTC dominance) have notable influence, though direct XRP price drivers are more nuanced given the cross-asset dynamics.
Momentum indicators suggest a balanced-to-softly bearish backdrop when considering broader volatility and breadth metrics, aligning with the current slate of risk signals observed in the microstructure data.
ETF Flows (BTC/ETH)
The ETF flow data provided concerns BTC and ETH rather than XRP. 1D BTC ETF flows show a negative 263.2 million, with series over 5D and 10D showing net declines and a large 10D positive flow of +1.07 billion. ETH ETF data shows -48.4 million in 1D, -21.3 million in 5D, and +274.2 million in 10D. This information should be interpreted as context for risk appetite and macro liquidity rather than a direct signal for XRP pricing.
Interpretation: The BTC/ETH ETF flows suggest a net risk-off or caution tone in the near term, given the notable BTC outflow on the latest day and modest ETH outflows alongside longer-horizon inflows. However, this context does not replace XRP-specific signals and should be considered as backdrop rather than a primary trading driver for XRP.
What to Watch Next
- Monitor price action around 1.40 to confirm the upside breakout; a sustained close above this level strengthens the 1.4361–1.4642 target window.
- Watch for a break below 1.36, which would open a path toward 1.3256–1.2986.
- Keep an eye on XRP’s RSI movement and volatility regime; a shift from very low to higher volatility could precede a larger intraday move.
- Consider cross-asset context from BTC/ETH flows as sanity checks for risk sentiment, while prioritizing XRP-specific levels and order-flow signals.
Hashtags: marketanalysis, XRP, cryptoTA, ETFflows, BTC, ETH, riskon, riskoff, priceaction, liquidity, orderflow, crypto