Market Snapshot
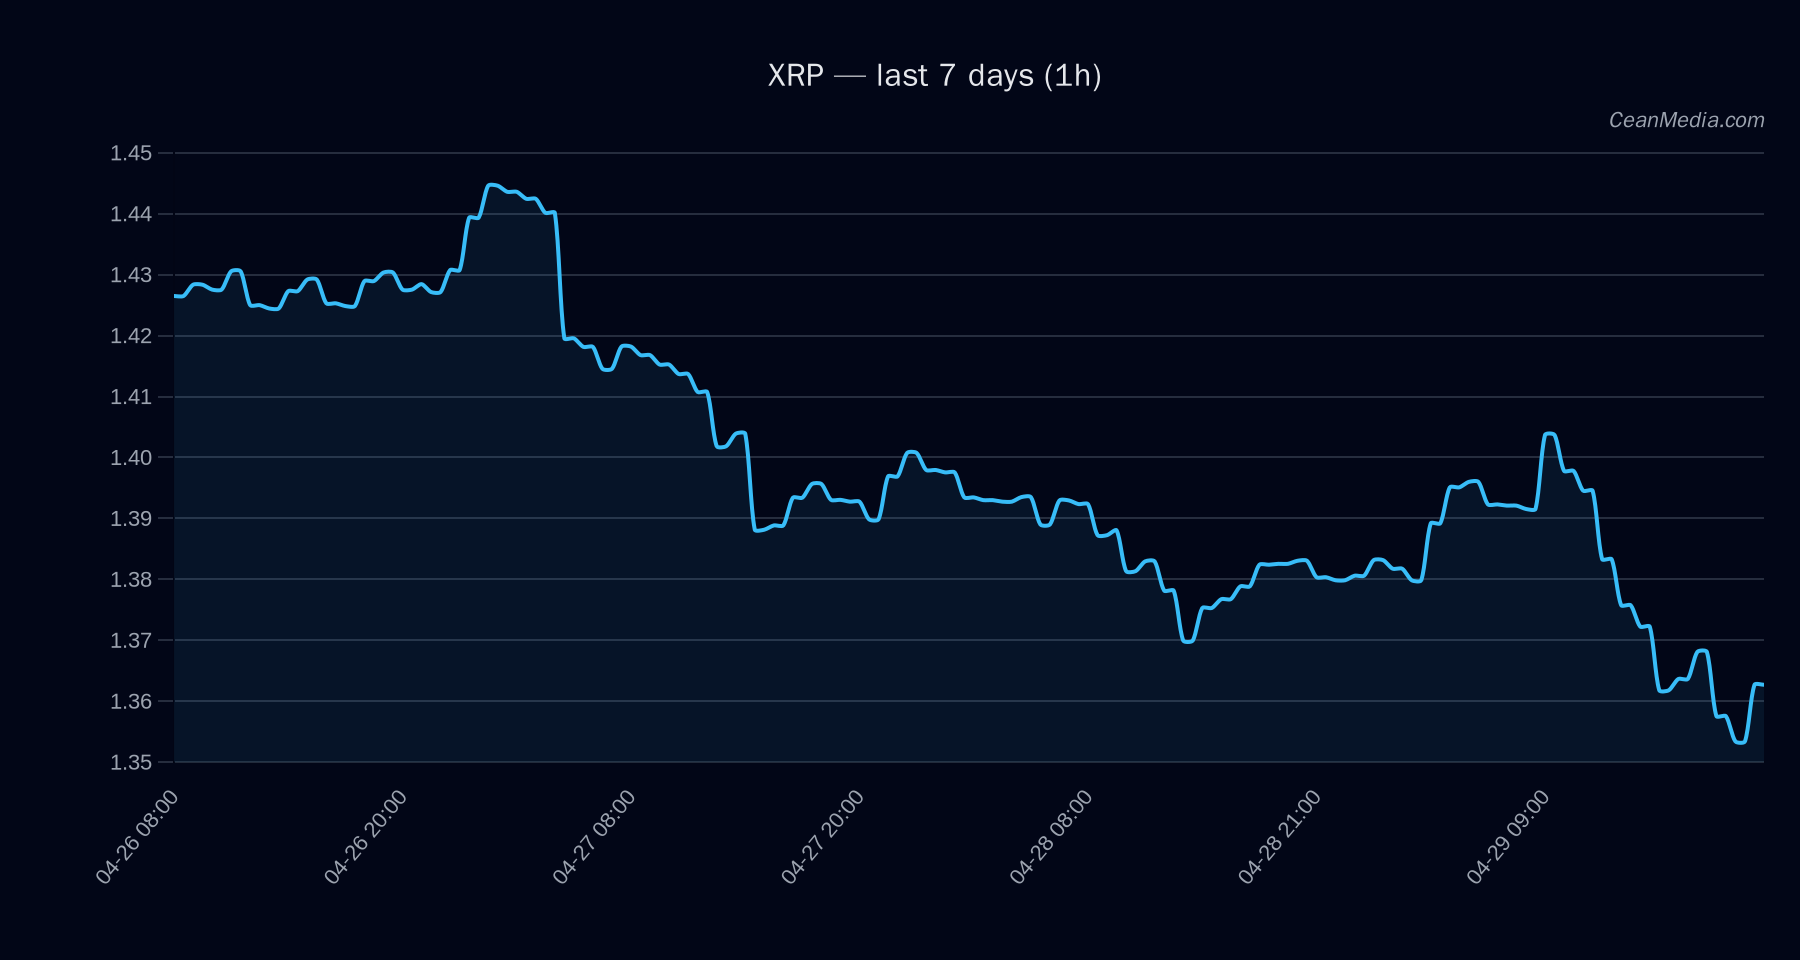
As of 2026-04-29, XRP sits in a narrow trading range between the major support at 1.36 and near-term resistance at 1.40, with a current price around 1.367. The asset’s short-term forecast points to a sideways path with modest probability weights for upside and downside, anchored by low volatility and mixed momentum indicators.
Technical Analysis: XRP
- Current price: 1.3671
- Bias: Bearish-leaning within a sideways setup (62% combined probability for sideways or down vs 38% for up per model output)
- Key indicators: EMA12 < EMA26, SMA50 < SMA200; RSI at 42; volatility (σ24h) 0.47%; volume regime: Very low
- Support / Resistance: Major support at 1.36, near-term support at 1.34; major resistance at 1.44, near-term resistance at 1.40
- Upside trigger: 1h close > 1.40 → potential move toward 1.4223–1.4502
- Downside trigger: 1h close < 1.34 → potential move toward 1.313–1.2862
- Band: P20–P80 range 1.3136 – 1.4022; P50 (median) 1.3833
- Forecast: Sideways (confidence ~30.6%); price range projection for the next 24 hours spans from about 1.3136 to 1.4022
- Top drivers (selected): FNG VALUE, RV 7D, STABLE MCAP LOG1P, GOLD SILVER RATIO Z-SCORE, LIQ TO OI Z-SCORE, VOL OF VOL
Drivers
- Top drivers: FNG VALUE contributes positively; RV 7D and stable capital metrics show mixed signals; Fund/volatility metrics remain subdued with very low vol regime.
- Momentum context: Trend indicators (EMA slope, trend strength) show a modest negative tilt; RSI is neutral at 42, consistent with a balanced short-term outlook.
- Other considerations: Distance from moving averages is slightly negative, with drawdowns modest over 30 days.
ETF Flows (BTC/ETH)
ETF flow data is provided for BTC and ETH and is included for contextual market breadth. The data does not represent XRP-specific signals. Current reading shows:
- BTC ETF flows: -1D: -$89.7M; -5D: -$199.0M; -10D: +$572.3M
- ETH ETF flows: -1D: -$21.8M; -5D: -$80.6M; -10D: +$201.3M
Interpretation: The BTC/ETH ETF flows suggest near-term risk-off to mixed risk appetite in broader crypto markets, which can influence liquidity environments and correlation dynamics. This context is provided as a macro backdrop and is not a primary signal for XRP trading decisions.
What to Watch Next
- Watch for a daily close above 1.40 to validate the upside trigger toward 1.4223–1.4502.
- Monitor a daily close below 1.34 for acceleration toward 1.313–1.2862 levels.
- Assess any shift in vol regime or a change in RSI from neutral to bullish/bearish as confirmation of trend strength.
- Track BTC/ETH ETF flow momentum as a broader market sentiment proxy while keeping XRP-specific signals primary.
Hashtags: #XRP #CryptoAnalysis #TechnicalAnalysis #MarketSnapshot #ETFFlows #BTC #ETH #CryptoMarket #TradingStrategy #RiskManagement #Liquidity