Market Snapshot
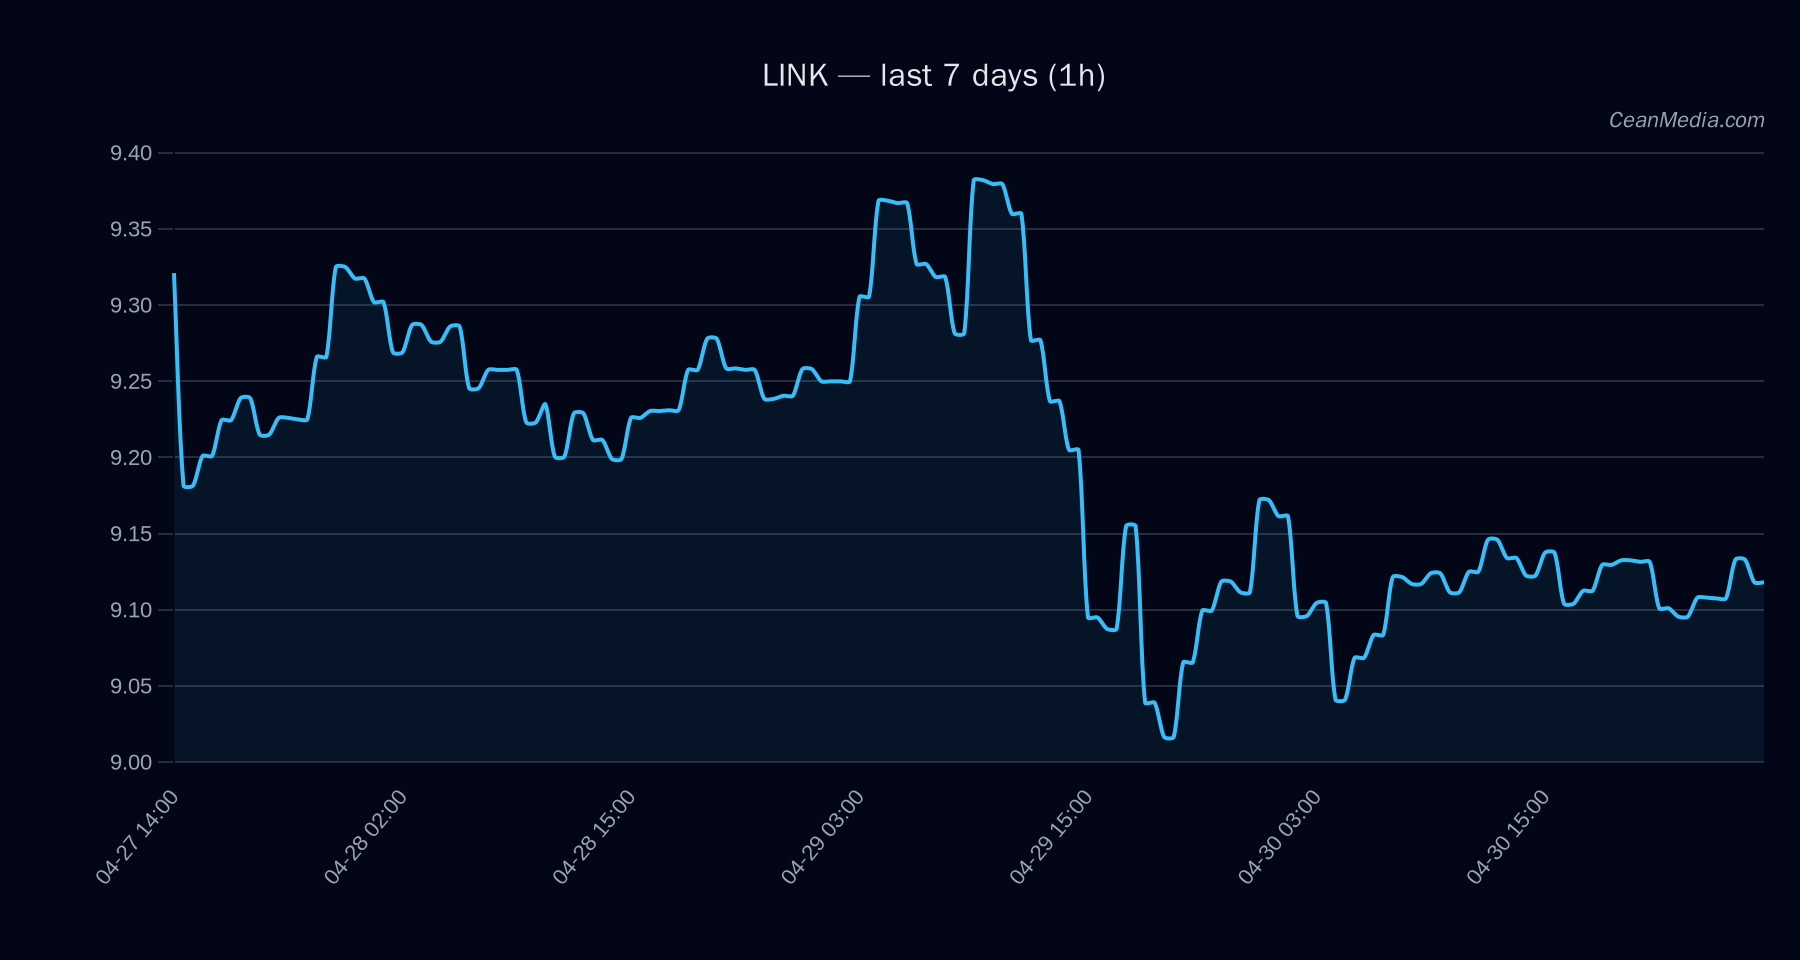
LINK is trading near the 9.0–9.36 range, with a current price around 9.18. The short-term forecast suggests a slight bias toward upside (50%) within a broad support-resistance band. Market breadth is favorable (Breadth>50h at 83%), and BTC dominance sits around 58.1%, showing a calm market environment with very low volatility regime.
Technical Analysis: LINK
~9.18 9.12; Near: 9.00 - Resistance (Major): 9.52; Near: 9.36
- Forecast: Up (50%); Bias: Sideways/Neutral with potential for upside break
- Band/predictive range (P20–P80): 8.72 – 9.37; P50: 9.0543
- Key triggers: Break above 9.36 targets 9.55–9.74; Break below 9 targets 8.82–8.64
- RSI: 59 (neutral)
- Vol Regime: Very low
- EMA/SMA configuration: EMA12 < EMA26; SMA50 < SMA200 (bullish alignment tendencies)
Top model drivers indicate mixed contributions, with notable upside from FNG VALUE and RV 7D, but negative contributions from SPREAD and DEPTH signals. The overall implied 24-hour price move remains modest given subdued volatility.
Drivers
- Top contributors: FNG VALUE, RV 7D, SPREAD Z-SCORE, GOLD/SILVER RATIO Z-SCORE
- Market breadth: 83% (Breadth > 50h)
- BTC correlation/trend: ρ(BTC,72h) ≈ 0.91 with BTC trend strength positive
- Volatility regime: Very low; distance from moving averages is near neutral
- Fundamental/flow signals: ETF flows context (see section below) provide ancillary context but are not primary drivers for LINK
ETF Flows (BTC/ETH)
Contextual note: ETF flow data shown here pertains to BTC and ETH only. These figures are not a primary signal for LINK but offer macro risk-on/off context that can influence overall market sentiment and risk appetite.
- BTC ETF: 1D -$82.9M | 5D -$370.8M | 10D +$595.2M
- ETH ETF: 1D -$48.4M | 5D -$160.4M | 10D +$145.8M
Interpretation: The BTC ETF shows net selling on the 1D/5D horizons with modest longer-dated inflows, suggesting a cautious or selective risk-off tilt in the near term. ETH ETF data mirrors this tendency in the shorter windows. The ETF data acts as a contextual read for risk appetite rather than a direct driver for LINK trading signals.
What to Watch Next
- Break above 9.36 to confirm upside momentum toward 9.55–9.74.
- Break below 9.00 to re-scope support toward 8.82–8.64.
- Monitor volatility regime; very low volatility could precede a compression followed by a breakout.
- Observe BTC/ETH ETF flow shifts for shifts in risk appetite that could precede broader market moves.
Hashtags: #LINK #CryptoAnalysis #TechnicalAnalysis #MarketSnapshot #ETFFlows #BTC #ETH #AltMarkets #PriceAction #RiskOn #Liquidity #Volatility