Market Snapshot
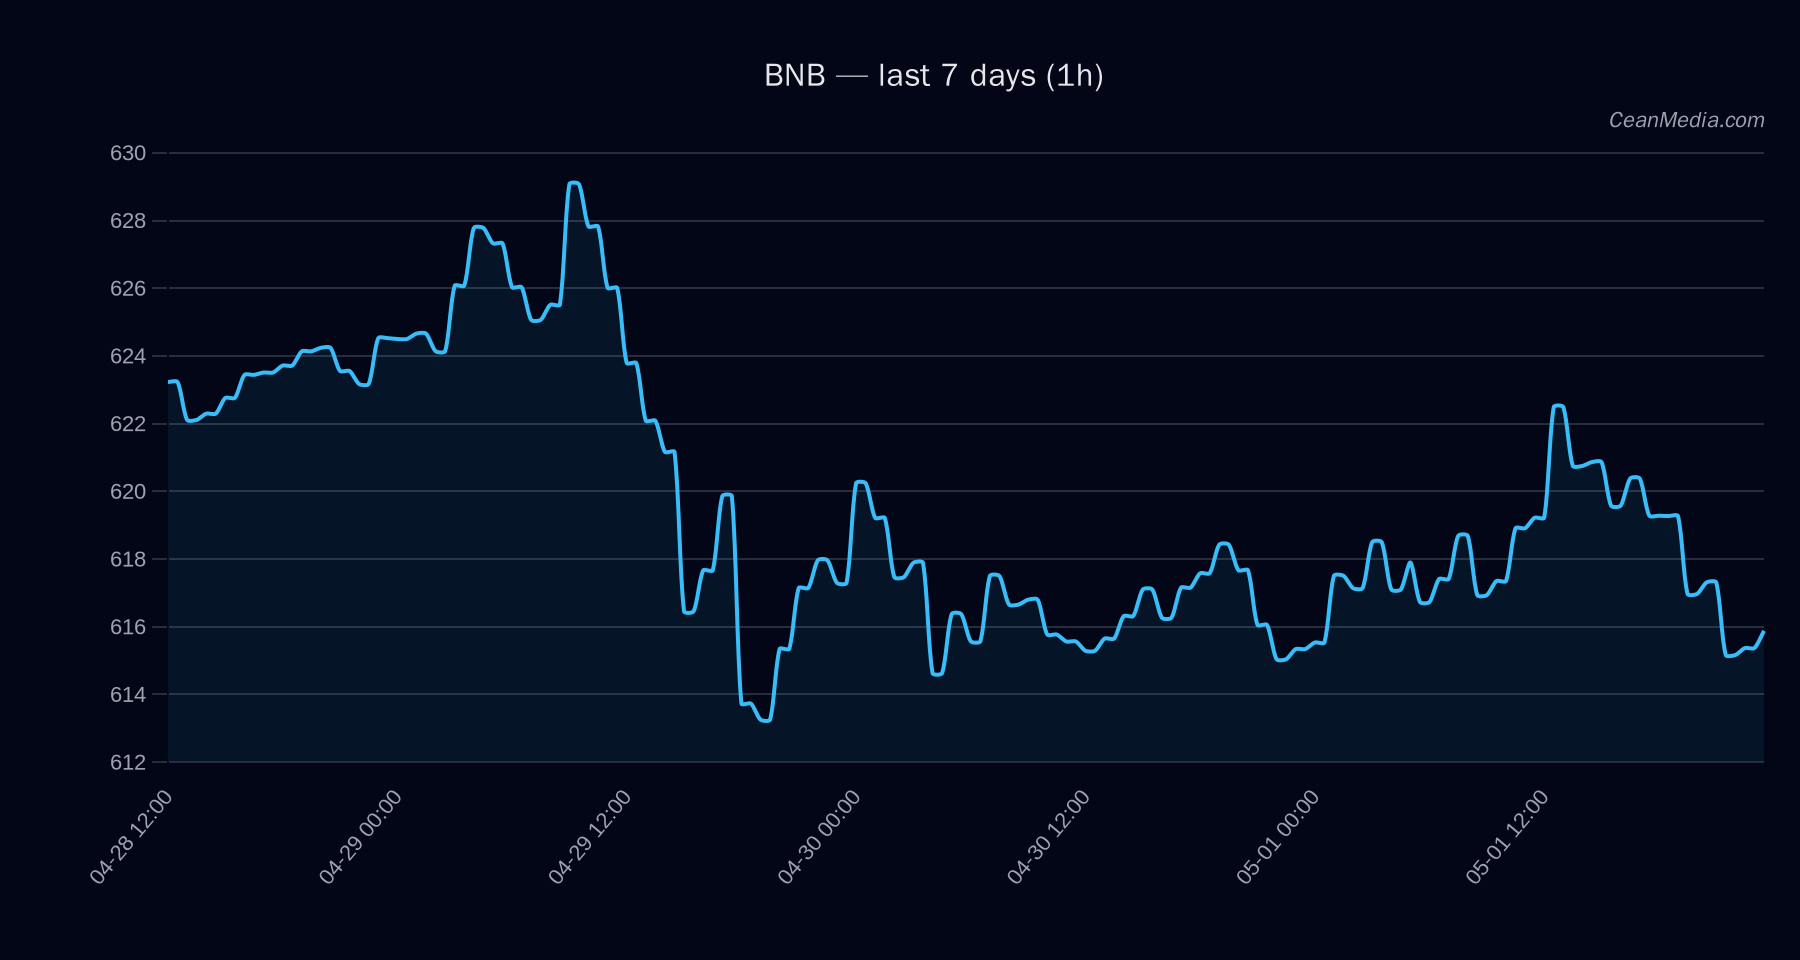
BNB is currently trading around the mid-600s with a bearish tilt visible in the near term. The asset sits between a near-term support at 604 and a resistance around 629, with a break above 629 potentially targeting 641.26 to 653.83, while a break below 604 could lead toward 592 and 580-579 levels. Market breadth remains constructive (breadth >50h: 83%), and overall volatility is characterized as very low.
Technical Analysis: BNB
- Current price: 616.36
- Short-term forecast: Down (65%)
- Probabilities: Up 17%, Sideways 18%, Down 65%
- Key indicators: EMA12 < EMA26; SMA50 < SMA200; RSI 45; Volatility regime: Very low
- RSI: Neutral at 45
- Support: Major 617, Near 604
- Resistance: Major 640, Near 629
- Trend drivers: Bearish momentum indicated by EMA/MA crossovers; price action suggests downside bias near term
- Invalidation/Triggers: Break above 629 reopens bullish contention toward 641.26–653.83; break below 604 confirms downside extension toward 591.95–579.87
- Top model drivers: LIQ IMB EMA12 positive contribution; RV 24H and LS TOP Z-SCORE negative contributions; Depth USD 10BP LOG1P positive signal; BTC-related factors showing mixed influence
Drivers
Return 24H, EMA slope, Funding Z-Score, Basis Z-Score, Order-Book Imbalance (EMA5), BTC return 24H Vol regime is Very low; RSI on the edge of neutral; overall trend strength subdued (trend_strength ≈ 0.05) BTC dominance around 58.51% with +0.37% over 24 hours; alt breadth ex-mega at 100% signaling broad participation but subdued price action
ETF Flows (BTC/ETH)
The ETF flow context provided pertains to BTC and ETH rather than BNB. BTC ETFs show +$4.4M in the last day with sizeable 5- and 10-day frames turning negative and positive, respectively; ETH ETFs show -$3.4M on the day with negative 5-day and positive 10-day movement. This data is included as contextual market sentiment rather than a primary signal for BNB. The broader implication is a mixed risk-on/off threading in the crypto complex, with BTC showing modest net inflows while ETH experiences a small outflow in the near term.
What to Watch Next
- Monitor for a break above 629 to validate a near-term bullish adjustment toward 641.26–653.83.
- Watch for a break below 604 to confirm downside continuation toward 591.95–579.87.
- Assess any shifts in ETF flow context for BTC/ETH as a gauge of risk appetite, recognizing it is not a direct signal for BNB.
- Keep an eye on RSI movement; a reclaim above 50 could precede a modest upside relaunch if accompanied by favorable breadth dynamics.
Hashtags: #crypto #BNB #trading #technicalanalysis #ETFFlows #BTC #ETH #marketview #riskmanagement #defi #blockchain