Market Snapshot
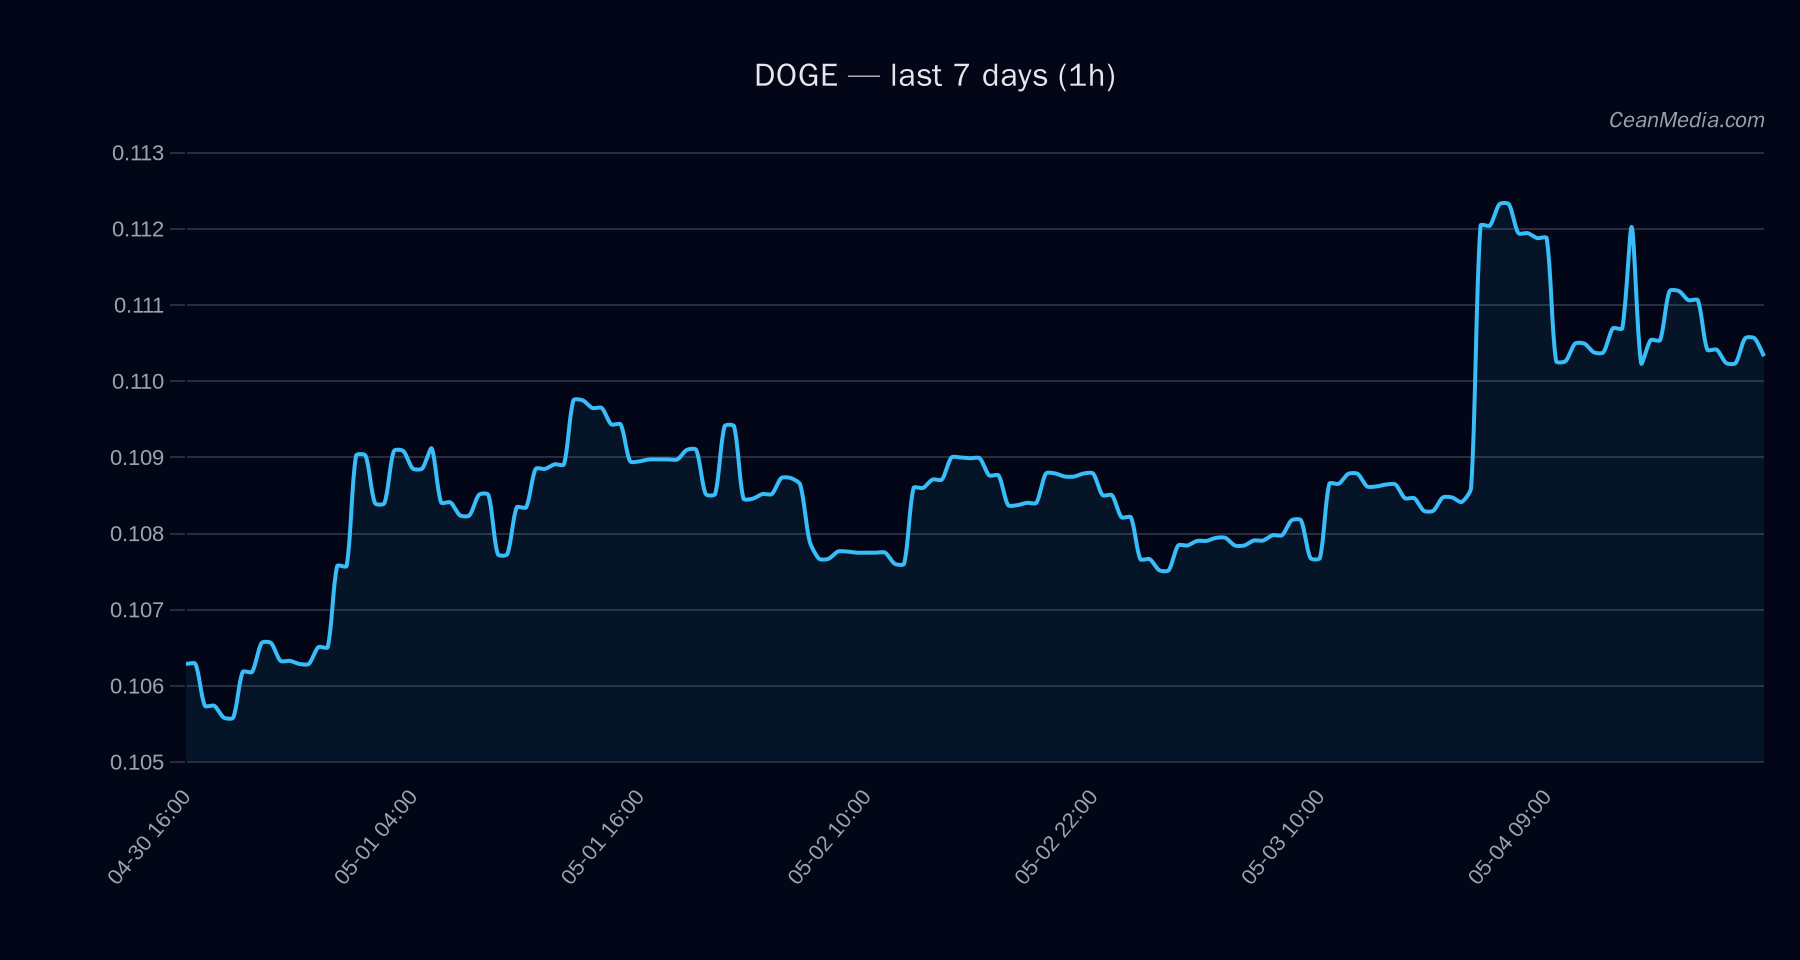
Dogecoin (DOGE) is trading near the 0.11 level as of the close on 2026-05-04. The setup shows a bullish tilt with low data certainty; momentum indicators remain mixed and the price action is probing resistance near 0.11. ETF flow data for BTC and ETH is provided here as contextual market context and should not be treated as a primary signal for DOGE.
Technical Analysis: DOGE
- : bullish with certainty 26/100 (low). Composite score +2.7 with 0 conflicts.
- : Close ~0.11; forecast range P50 ~0.1114; P20-P80 0.1098–0.1141.
- : EMA12 > EMA26; SMA50 > SMA200; RSI ~50; 24h σ ~0.86%; Vol regime: Very low.
- : Support near 0.11; major support around 0.099. Resistance near 0.11; major resistance at 0.11.
- :
- Up: 1h close above 0.11 targets 0.1145–0.1167.
- Down: 1h close below 0.11 targets 0.1057–0.1035.
- : Not explicitly stated; given resistance near 0.11, a decisive close back below 0.11 would shift focus to lower trigger levels.
- : Direction Up with probability ~49% in the near term (24h horizon); 41% downside probability per model, signaling balanced risk around the current level.
- : Breadth is at 50% above SMA50; BTC dominance ~58.7% (7d up 0.6%).
Drivers
highlight mixed contributions: EMA slope modestly negative; Funding Z-score negative; Basis Z-score negative; OBIm balance negative; BTC dominance remains a tailwind for risk-on exposure in correlated assets. - : Vol regime is Very low with ATR ~0.0006 and vol unit ~0.0009; drawdown 30d modest at -1.78% (approx -0.0178 in log terms). BTC-dominance correlation over 7 days ~0.59; overall risk-on appetite remains nuanced.
- : Fear index (F&G) around 40; market breadth slightly positive at or just above 50% above SMA50.
ETF Flows (BTC/ETH)
ETF flow data shown here pertains to BTC and ETH only. This information is provided for market context and is not a primary signal for DOGE. The observed flows indicate risk-on demand in BTC and ETH products, which can influence broader crypto risk sentiment and correlated assets, but DOGE positioning should be assessed on asset-specific signals.
- BTC ETF: +$629.8M (1D), +$198.4M (5D), +$585.2M (10D)
- ETH ETF: +$101.2M (1D), -$20.8M (5D), +$81.6M (10D)
What to Watch Next
- Watch for a daily close above 0.11 to validate upside triggers toward 0.1145–0.1167.
- Monitor 1h closes around 0.11; rejection below this level could shift bias toward 0.1057–0.1035.
- Keep an eye on BTC/ETH ETF flow momentum as a contextual read on broader risk appetite; use caution interpreting this as a DOGE signal.
- Observe changes in volatility and breadth signals as they may precede more decisive moves.
Hashtags: #DOGE #CryptoTechnical #MarketSnapshot #ETFFlows #Bitcoin #Ethereum #CryptoAnalysis #TechnicalAnalysis #TradingSignals #BullishBias #RiskOn #MarketContext