Market Snapshot
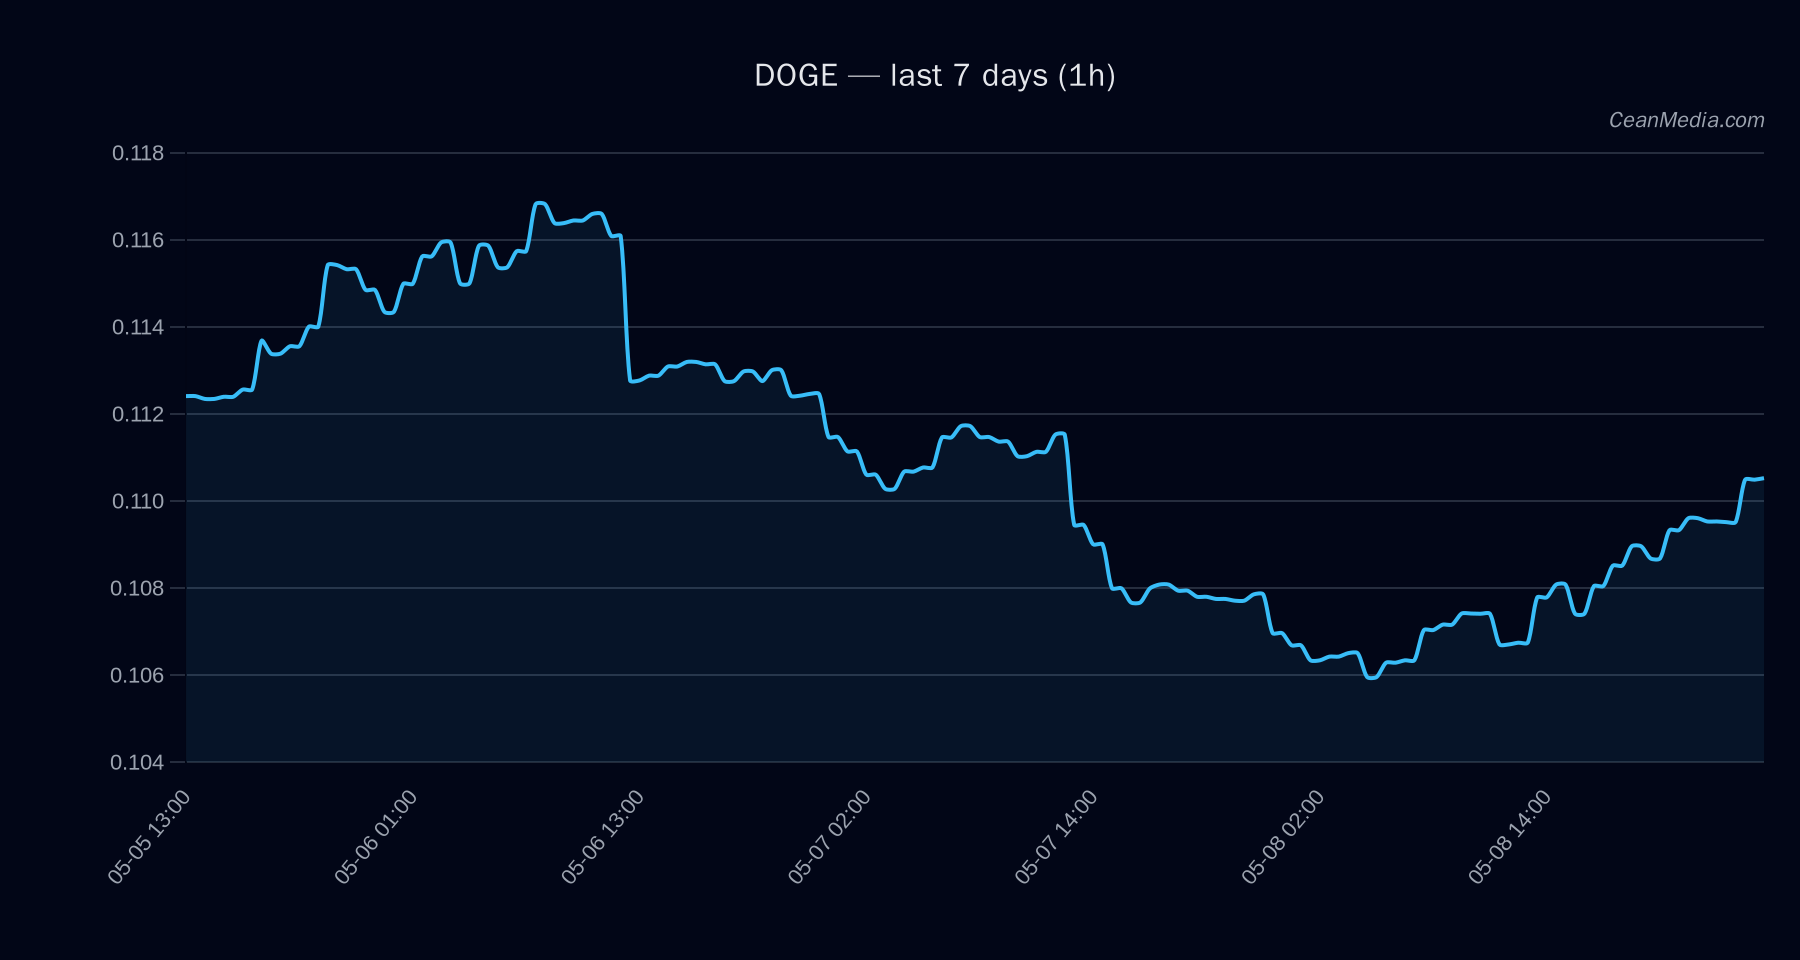
Dogecoin (DOGE) is trading around the 0.1106 area, holding near intraday support of 0.11 and within a near-term range defined by 0.11 (support) and 0.115 (resistance). Market breadth is strong on the upside (>50h), with BTC correlation at 0.75 and a very low volatility regime. The composite view is mixed/neutral with a low certainty level, reflecting a sideways technical bias and subdued price action.
Technical Analysis: DOGE
- Bias: mixed/neutral
- Composite score: +0.6
- Price: Close 0.1106
- TA Trend: Sideways; RSI 69; EMA12 > EMA26; SMA50 < SMA200
- Volatility: Very low (σ24h 0.41%, ATR 0.0004)
- Key levels: Support near 0.11; Major support at 0.10; Resistance near 0.115; Major resistance at 0.11
- Forecast range (24h): P50 0.1126; P20-P80 0.1122–0.1212
- Traders’ triggers: Up: 1h close > 0.115 (targets 0.1151–0.1174); Down: 1h close < 0.11 (targets 0.1063–0.1041)
- Invalidation/confirmation: Breaks of 0.115 or 0.11 guide directional expectations; no breakout confirmation yet.
Drivers
- Top model drivers: Return 24H (0.04), EMA slope (0.0022), Funding Z-score (-0.665), Basis Z-score (-1.417), OBI EMA5 (0.091), BTC return 24H (0.012)
- Market context: Cross-market risk assets supportive; stablecoin liquidity expanding; sentiment shows fear (F&G 38)
- Bitcoin dynamics: BTC.D 58.1% (-0.4pp/7d); BTC correlation (72h) 0.75
- Volatility regime: Very low; vol of vol 0.0065
- Flow dynamics: Taker sell pressure; long crowding (1.51x)
ETF Flows (BTC/ETH)
This section provides context based on BTC/ETH ETF flows. Data indicates BTC ETFs are exhibiting positive inflows (1D +$629.8M; 5D +$198.4M; 10D +$585.2M) and ETH ETFs are also showing inflows (1D +$101.2M; 5D -$20.8M; 10D +$81.6M). It is important to note: ETF data shown here is for BTC/ETH only and should be treated as context, not a primary signal for DOGE. DOGE price action should be interpreted independently of ETF flows for BTC/ETH.
What to Watch Next
- Watch for a close above 0.115 on a 1-hour bar to validate a short-term upside extension toward 0.1151–0.1174.
- Monitor for a break below 0.11 on a 1-hour bar to assess downside risk toward 0.1063–0.1041.
- Observe ETF flow momentum in BTC/ETH as potential risk-on/risk-off backdrop implications for broad market sentiment.
- Maintain awareness of volatility regime; very low volatility can precede abrupt moves if triggers are hit.
Hashtags: #Dogecoin #DOGE #CryptoMarkets #TechnicalAnalysis #ETFFlows #BTC #ETH #MarketSnapshot #TradingStrategy #Liquidity #RiskOn #Volatility