Market Snapshot
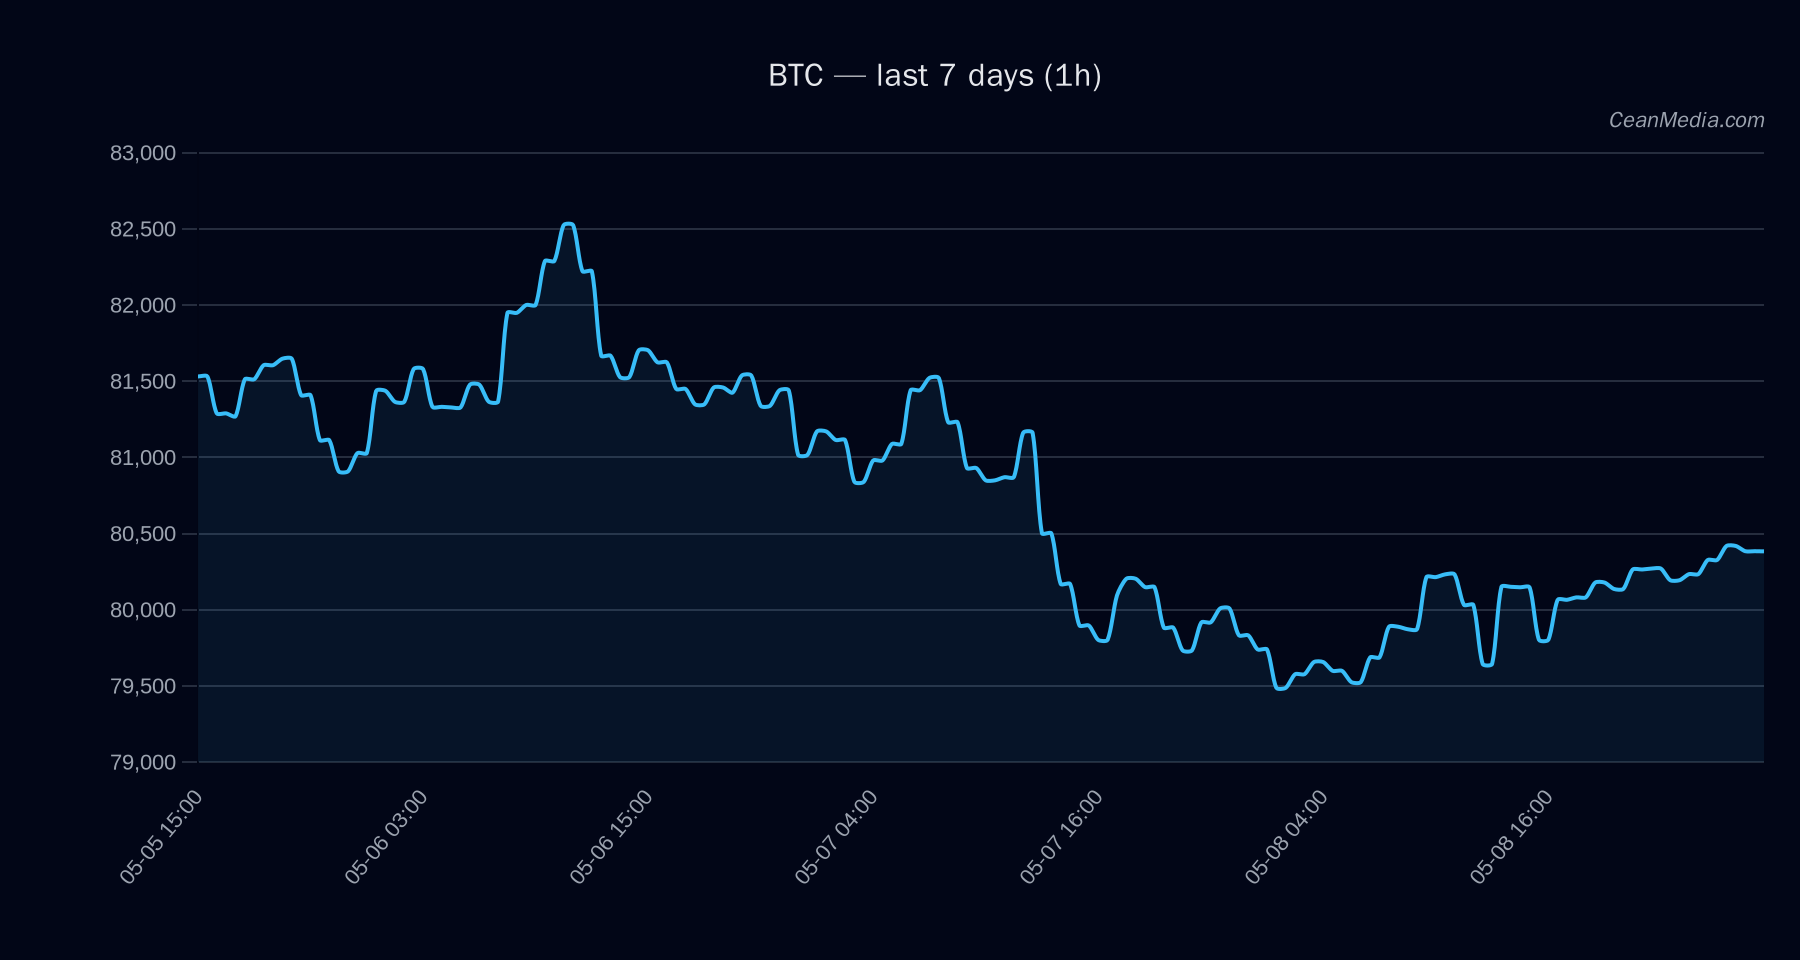
On 2026-05-09, BTC trades with a bullish bias in a very low volatility regime. The price sits around 80,370 with key levels influencing near-term direction. ETF flow data for BTC/ETH provides context on risk appetite but should not be considered a primary signal for BTC price action.
Technical Analysis: BTC
Bias: bullish | certainty: medium (55/100)
Composite score: +3.8 | Conflicts: 0
Price: Close 80,370.01
Model forecast: Down (46%); Up 41%; Side 14% | Down 46%
TA trend: bullish | RSI 56
- EMA12 > EMA26
- SMA50 > SMA200
- RSI 56
- σ24h 0.24%
- Vol regime: Very low
Levels
- Support: near 78,775 | major 76,500
- Resistance: near 81,975 | major 81,100
Forecast range: P50 82,134.42; 20-80% band 81,212.80 – 83,313.50
Triggers
- Up: 1h close > 81,975 ⇒ 83,616.96 – 85,256.51
- Down: 1h close < 78,775 ⇒ 77,187.36 – 75,612.11
Context: Breadth 100% above SMA50; BTC.D ~58.1% (slightly down); volatility regime very low; ρ(BTC,72h) = 1.00
Drivers
- Top drivers reflect a mix of price action, momentum indicators, and cross-asset context. Key contributors include EMA slope, funding and basis z-scores, and order-book dynamics.
- Read: BTC currently sits between the 78,775 support and 81,975 resistance. Breaks beyond those levels define subsequent targets.
ETF Flows (BTC/ETH)
ETF flow data summarized (BTC/ETH only). It is important to note that ETF data provides context on risk appetite, not a direct signal for BTC price. BTC ETF flows show a notable 1D positive movement, with multi-day inflows in BTC, and ETH displaying mixed signals.
- BTC ETF: 1D +$629.8M | 5D +$198.4M | 10D +$585.2M
- ETH ETF: 1D +$101.2M | 5D -$20.8M | 10D +$81.6M
Interpretation: The BTC ETF inflows suggest persistent demand from institutional vehicles, which may support risk-on conditions in the near term. However, these flows should be weighed alongside micro-structure signals and macro factors when assessing BTC trajectory.
What to Watch Next
- Watch for a close above 81,975 to target 83,616.96 – 85,256.51 if momentum confirms.
- Monitor a break below 78,775 as an early sign of potential downside to 77,187.36 – 75,612.11.
- Observe changes in ETF flows for BTC as a risk-on/off signal, while treating it as supplementary rather than primary guidance.
- Keep an eye on cross-market signals and volatility regime shifts, which could alter the current very-low volatility context.
Hashtags: #BTC #Bitcoin #MarketUpdate #TechnicalAnalysis #ETFFlows #CryptoNews #PriceAction #Liquidity #MarketSentiment #RiskOn #Volatility #ETFFlows