Market Snapshot
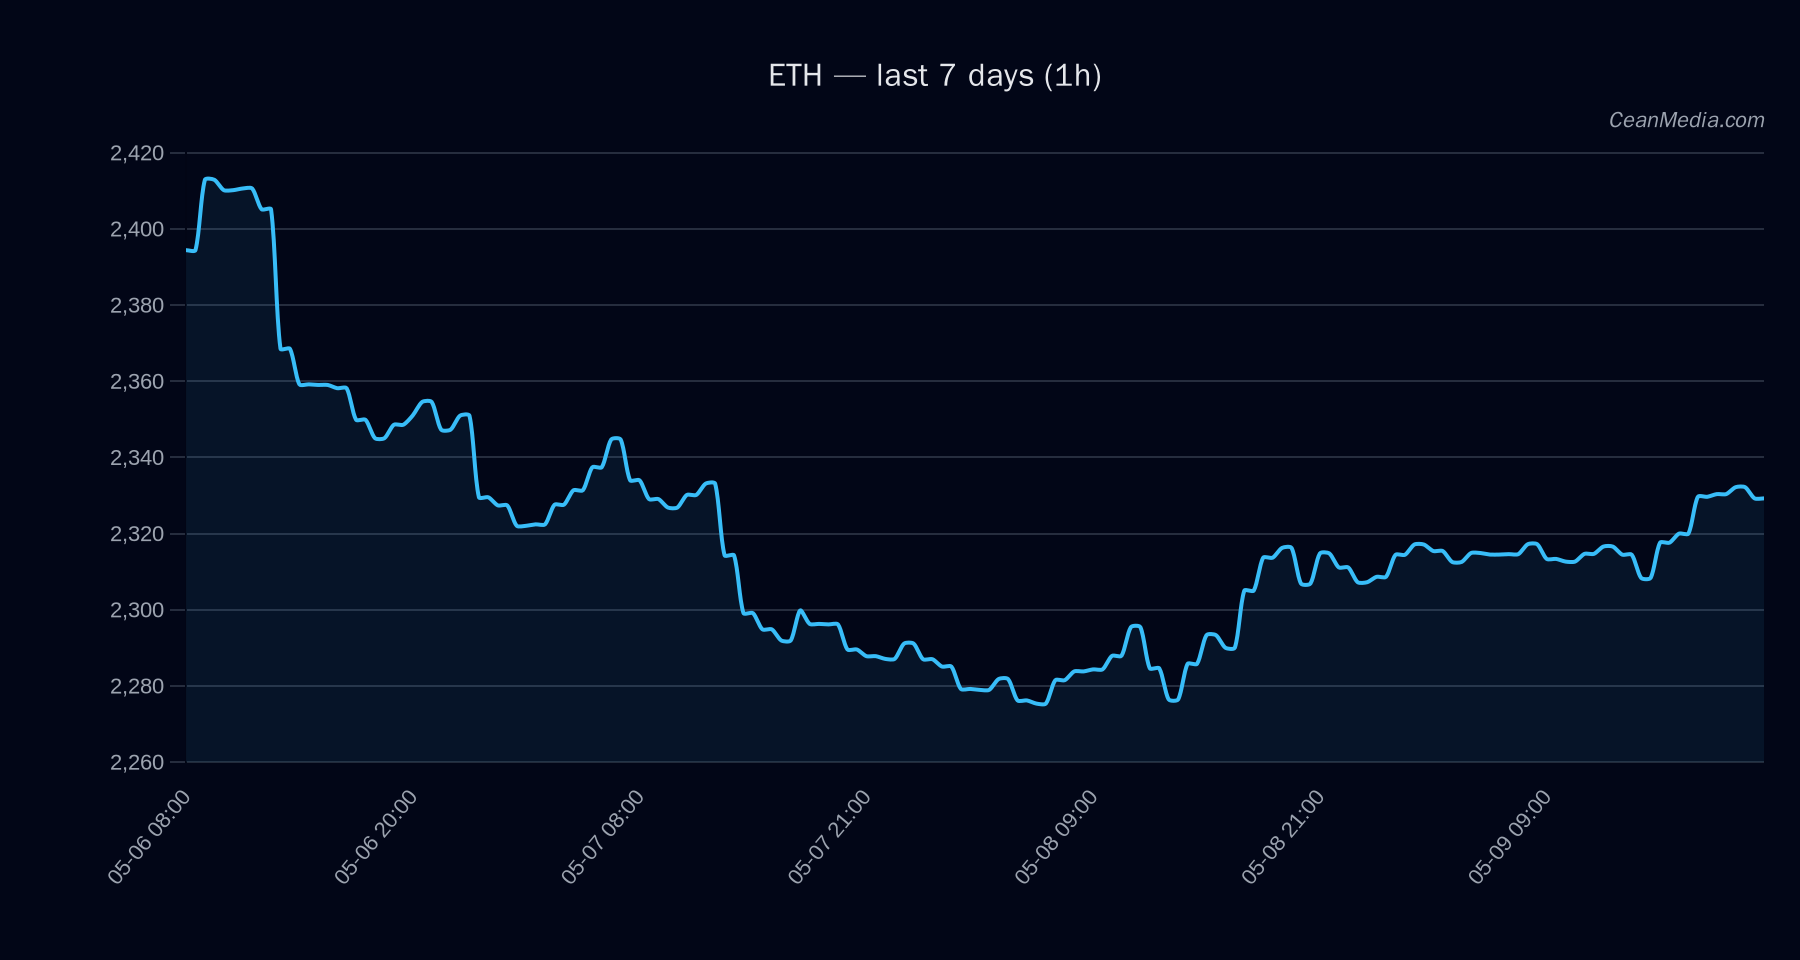
ETH trades around the 2,329 price level with a bias toward upside in the near term, supported by a favorable technical setup and modestly constructive macro signals. Market breadth remains robust, and BTC-ETH correlation is high (0.80 over 72h), underscoring the interlinked risk-on environment observed in the broader crypto complex. ETF flows data is provided for context (BTC/ETH) and should not be treated as a primary ETH signal.
Technical Analysis: ETH
- Bullish (certainty 38/100)
- +2.6
- 2,329.48 (close)
- Sideways; RSI 64
- EMA12 > EMA26, SMA50 < SMA200, σ24h 0.18%, Vol regime: Very low
- 2,413.39
- P20-P80: 2,376.45 – 2,420.26
-
- Support near 2,282
- Major support near 2,276
- Resistance near 2,376
- Major resistance near 2,372
-
- Up: 1h close > 2,376 → 2,423.59 / 2,471.11
- Down: 1h close < 2,282 → 2,237.23 / 2,191.57
Market context shows very low volatility, with breadth at 100% above the 50-period average and a BTC correlation of 0.80, suggesting that moves in ETH are likely to align with broader risk-on/risk-off sentiment. The current RSI at 64 indicates room for upside before overbought conditions appear.
Drivers
- FNG VALUE (+3.33), BTC DOMINANCE (-2.04), NASDAQ100 RET 1D (+1.46), RV 24H (+0.96)
- BTC dominance and cross-asset signals show mixed flows; overall vol regime remains very low, limiting breakout momentum
- Longs show crowding in some spectra; producer and taker liquidity dynamics indicate orderly order flow with potential for short-term squeezes under triggered conditions
ETF Flows (BTC/ETH)
Contextual note: ETF flow data provided here is limited to BTC and ETH and should be interpreted as supplementary to ETH price action. It is not a primary signal for ETH trading decisions. BTC ETF flows show notable short-term inflows, while ETH ETF flows are positive on the 1D horizon but modest in magnitude relative to BTC. The presence of BTC-dominated ETF inflows can contribute to broader risk-on sentiment that may lift ETH in tandem, but ETH-specific catalysts remain a key driver.
- +$629.8M (1D), +$198.4M (5D), +$585.2M (10D)
- +$101.2M (1D), -$20.8M (5D), +$81.6M (10D)
What to Watch Next
- Monitor for a close above 2,376 on any 1-hour bar to validate the bullish trigger toward 2,423.59 and potentially 2,471.11.
- Watch for a break below 2,282 to signal a shift toward the 2,237.23 – 2,191.57 range, validating a potential downside scenario.
- Track ETF flow momentum in BTC and ETH cautiously; while supportive BTC flows can bolster sentiment, ETH-specific catalysts remain decisive.
- Maintain awareness of volatility regime; with very low vol, even small price moves can feel directional if driven by flow imbalances.
Hashtags: #ETHAnalysis #CryptoMarkets #ETHTechnical #ETFFlows #BTCETHCorrelation #MarketSnapshot #PriceAction #RiskOn #TechnicalTrading