Market Snapshot
As of 2026-05-09, SOL trades around the mid-90s in a low-volatility regime. The market backdrop shows risk assets broadly supported, with overall breadth at 100% above its 50-day average and BTC correlation at 0.65 over 72 hours. Updated context suggests a constructive stance for SOL within a defined range, pending a clear breakout above resistance or breakdown below support.
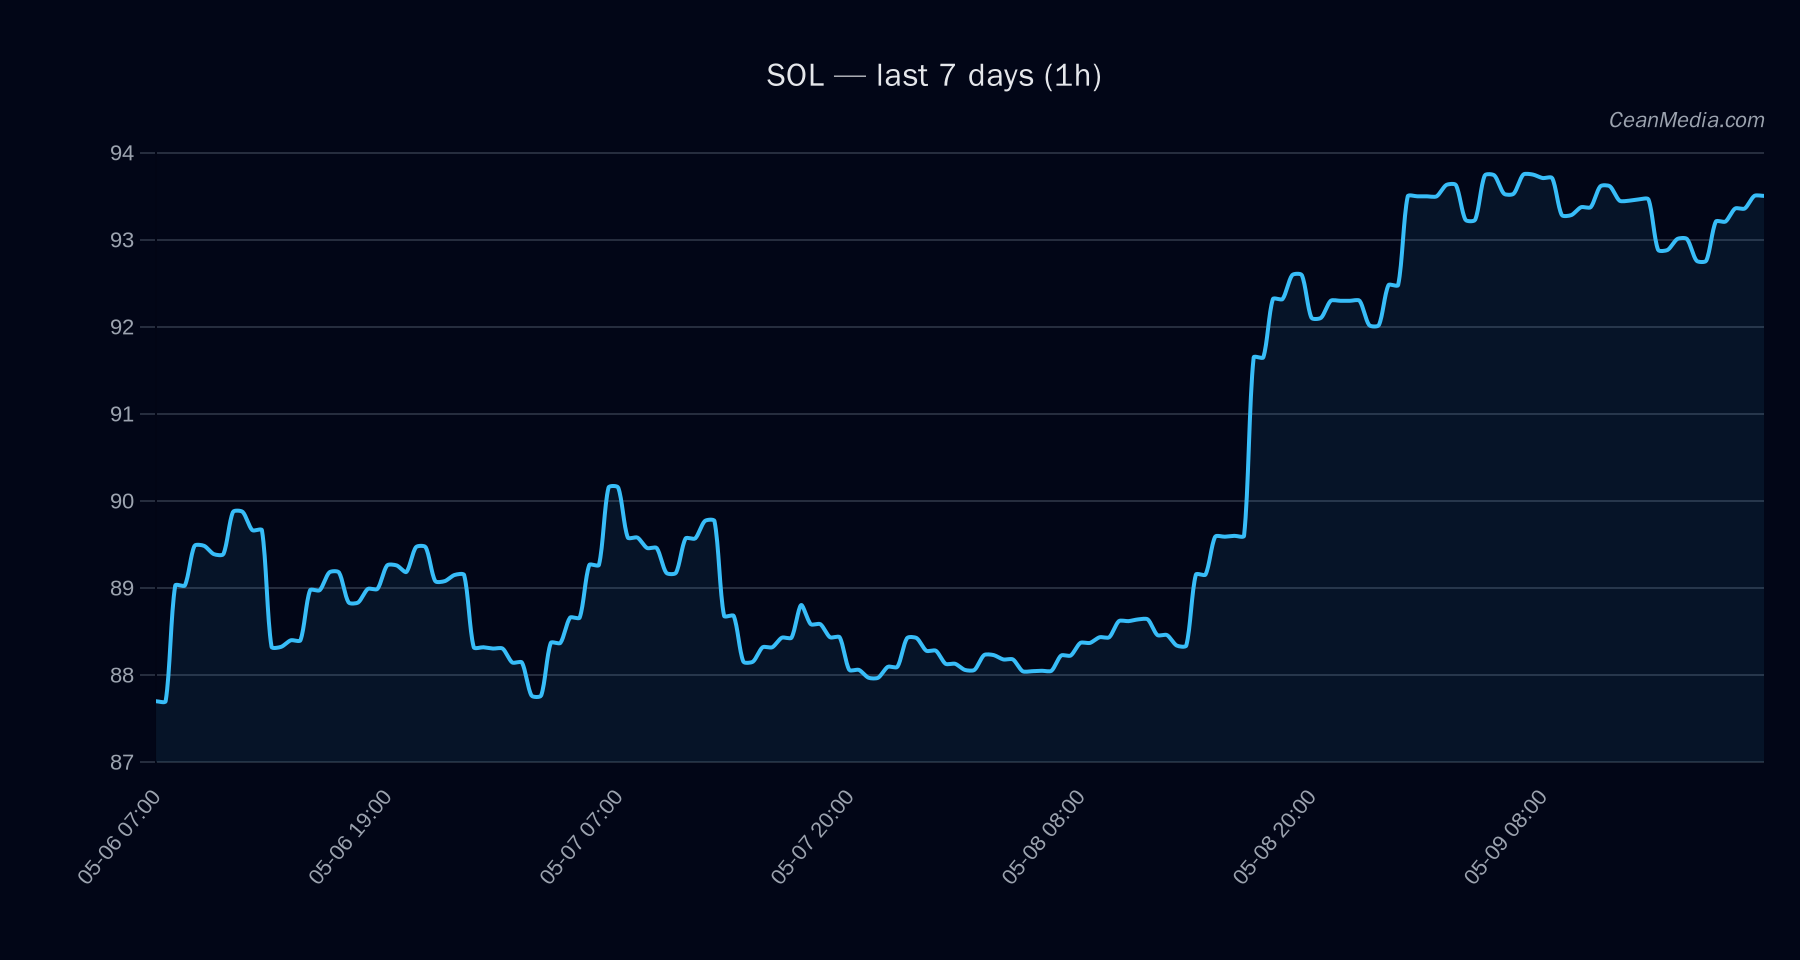
Technical Analysis: SOL
+3.7 | conflicts 0 93.23 EMA12 > EMA26, SMA50 > SMA200, σ24h 0.38%, Vol regime: Very low 89.90 86.89 – 106.86 - Up: 1h close > 95.1 ⇒ target 96.9965 – 98.8984
- Down: 1h close < 91.4 ⇒ target 89.5381 – 87.7108
Drivers
Return 24h, EMA slope, Funding Z-Score, Basis Z-Score, Order-book imbalance (EMA5), BTC 24h return Very low volatility regime; RSI remains neutral around mid-60s; market breadth favorable with BTC exposure supporting risk assets Cross-market risk assets supportive; stablecoin liquidity expanding; Fear index around 38 (moderate fear)
ETF Flows (BTC/ETH)
Context: ETF flow data provided is exclusively for BTC and ETH. While these flows illuminate broader risk appetite and liquidity trends, they are not primary signals for SOL and should be viewed as macro context rather than trade signals for SOL directly.
1D +$629.8M; 5D +$198.4M; 10D +$585.2M 1D +$101.2M; 5D -$20.8M; 10D +$81.6M
The overall ETF activity indicates positive risk-on liquidity for BTC/ETH over short and medium horizons, consistent with a constructive tone for risk assets. This context supports a general risk-on environment but does not constitute a SOL-specific buy signal on its own.
What to Watch Next
- Watch for a daily close above 95.1 to confirm upside continuation toward the 96.9965–98.8984 target band.
- Monitor for a daily close below 91.4 to validate a potential deeper correction toward 89.5381–87.7108.
- Keep an eye on volatility regime and market breadth, particularly any shift in BTC dominance or fear/sentiment indicators.
- Reassess if SOL breaks or fails to sustain the current trend during upcoming price action near resistance or support levels.
Hashtags: #Solana #SOL #crypto #trading #technicalanalysis #marketview #ETFflows #riskon #cryptomarket #cryptotrading #liquidity #volatility