Market Snapshot
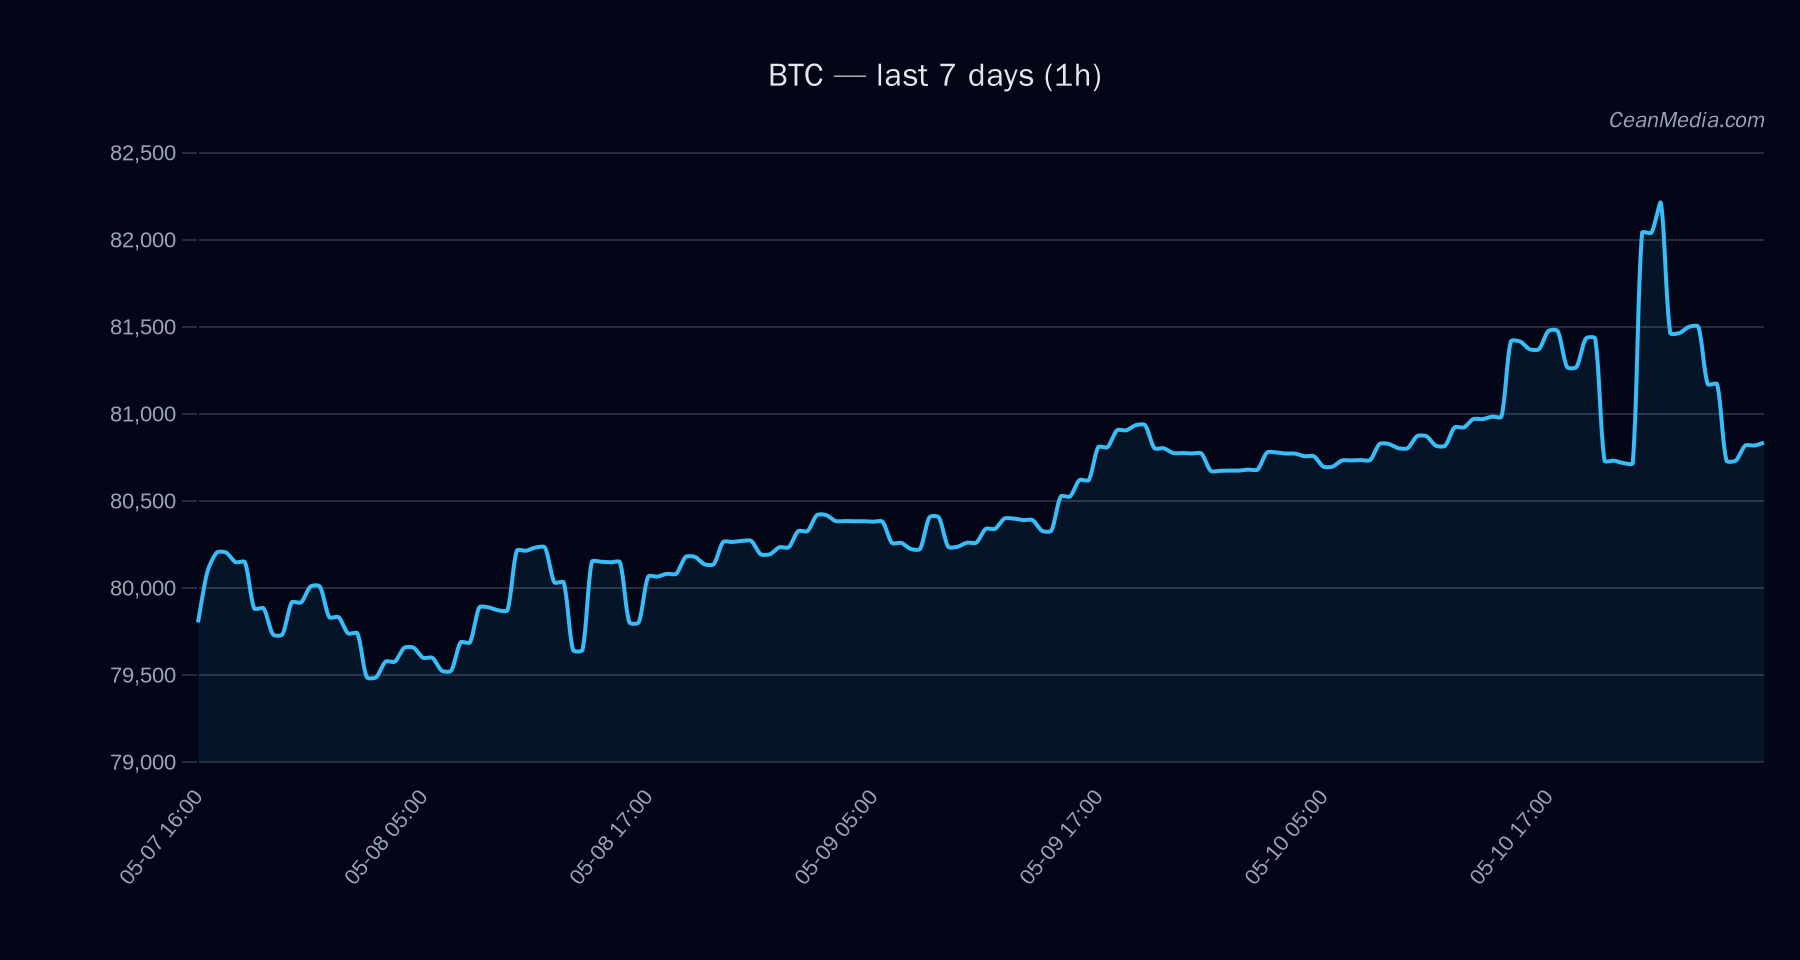
BTC remains range-bound amid very low volatility, trading between support near 79,225 and resistance near 82,450. The current close is 80,845.54, with a composite view skewed toward upside in the near term.
Technical Analysis: BTC
: - Support: near 79,225 (major 76,375)
- Resistance: near 82,450 (major 81,300)
: P50 81,130.24; P20-P80 78,473.46 – 82,465.91 - Up: a 1h close > 82,450 targets 84,111.70 – 85,760.95
- Down: a 1h close < 79,225 targets 77,644.06 – 76,059.48
: orderly momentum signals with mixed intraday flow (taker flow negative, bid-heavy book) support a cautious bullish stance.
Drivers
- Top model drivers indicate a mix of value signals and relative strength, with FNG VALUE contributing meaningfully to the path ahead.
- Market breadth is robust (100% above SMA50), and BTC correlates high with broad risk assets, suggesting macro alignment with a risk-on backdrop.
- BTC.D sits around 58.2% with a small daily decline, signaling a modest shift in dominance dynamics.
- ETF-related positioning shows positive flows into BTC and ETH ETFs over 1D/5D/10D windows, suggesting renewed institutional demand in BTC-focused vehicles. Note: ETF data is BTC/ETH-specific and should be treated as contextual signals, not sole drivers for BTC pricing.
ETF Flows (BTC/ETH)
: 1D +$629.8M; 5D +$198.4M; 10D +$585.2M : 1D +$101.2M; 5D -$20.8M; 10D +$81.6M
Interpretation: ETF data shows constructive demand for BTC exposure in the short to medium term, consistent with a risk-on tilt. However, given the data scope, ETF flows should be considered as context rather than a primary signal for BTC price action.
What to Watch Next
- Watch for a close above 82,450 on a 1-hour basis to validate the bullish trigger toward the 84,112–85,761 zone.
- A break below 79,225 would shift the setup toward pattern invalidation and potential re-test of lower supports.
- Monitor ETF flow momentum, particularly BTC ETF inflows, for signs of sustained institutional demand.
- Maintain awareness of cross-market risk assets performance, as continued upside correlation would reinforce the bullish bias.
Hashtags: #BTC #BitcoinAnalysis #MarketSnapshot #TechnicalAnalysis #ETFFlows #CryptoMarkets #CryptoTrading #RiskOn #PriceAction #Liquidity #Volatility #InstitutionalDemand