Market Snapshot
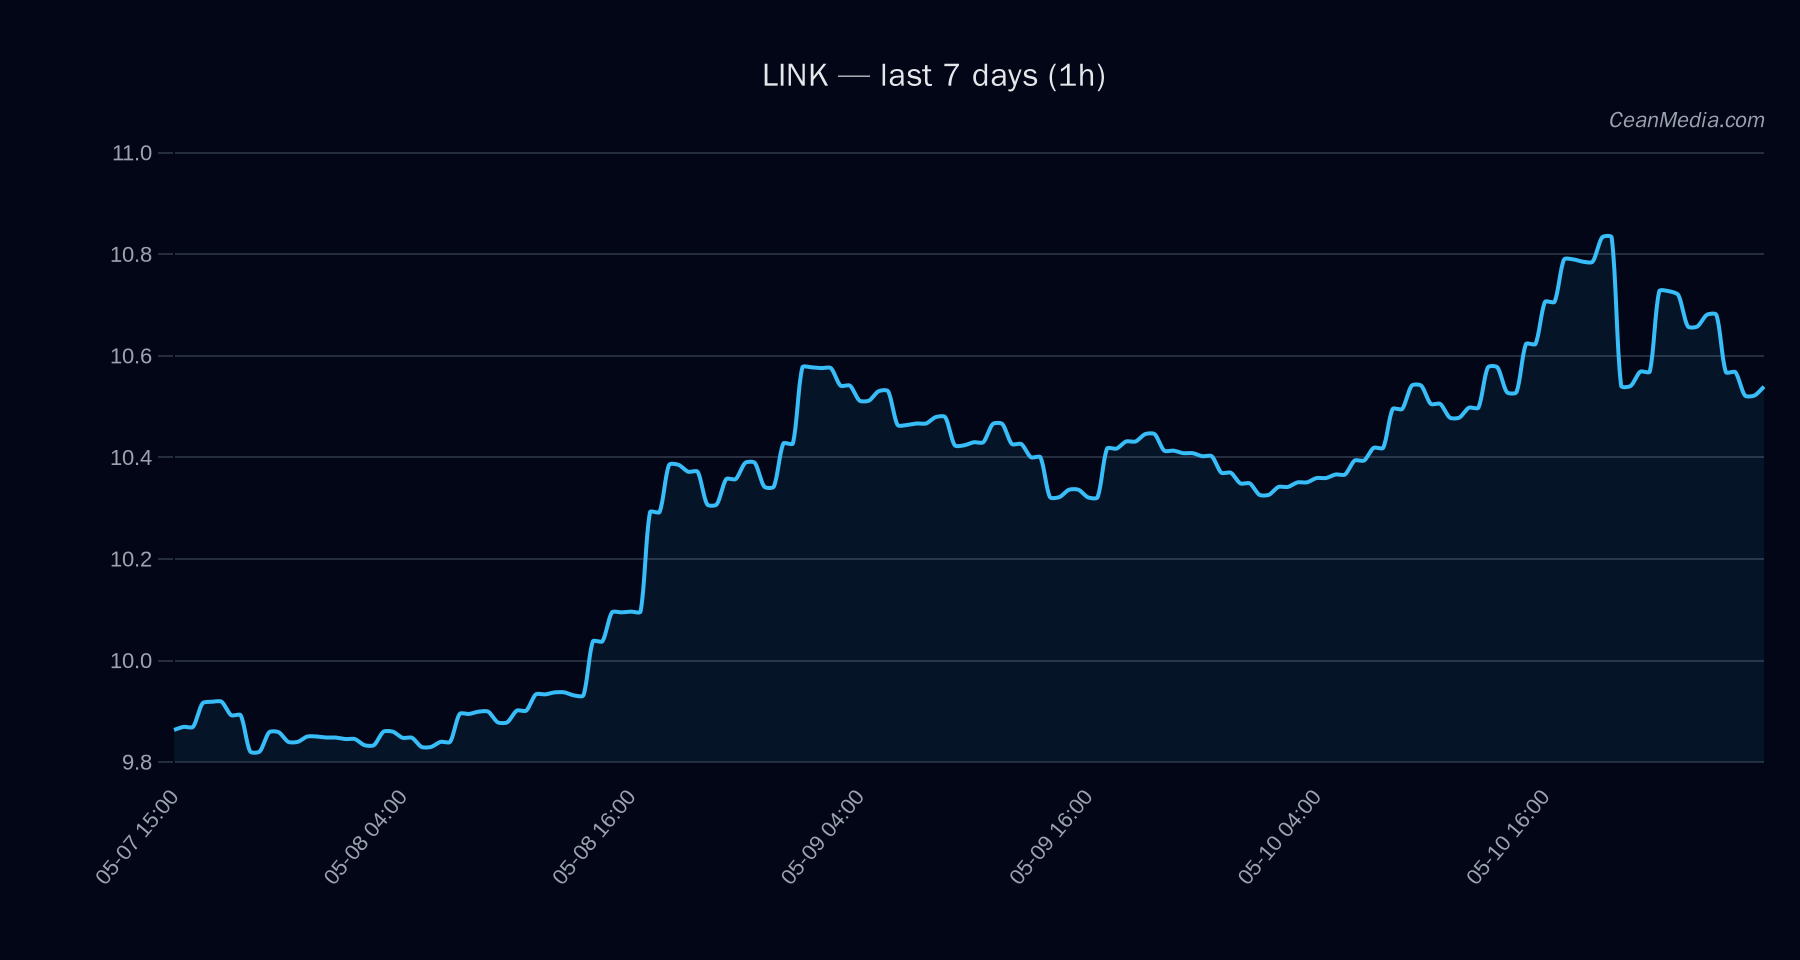
As of 2026-05-11, LINK trades around the 10.4–10.8 range with a close near 10.57. The broader data set indicates a mixed/bullish pressure with low certainty (5/100) and a composite score of +1.1 with two conflicting signals. Market breadth is robust (100% above SMA50) and BTC correlation stands at 0.66 over 72 hours, suggesting that LINK is not isolated from broader risk-on momentum but lacks high-conviction directional clarity at present.
Technical Analysis: LINK
: Close around 10.57; intra-range markers define: - Support near 10.4 (major at 9.4)
- Resistance near 10.8 (major at 10.4)
: P50 10.4319; P20–P80 range 9.8219–11.9797 - Up: 1h close > 10.8 implies potential move to 10.997–11.2127
- Down: 1h close < 10.4 implies move to 10.1514–9.9443
Drivers
(contributions indicate overall directional bias): - SPREAD BP: -8.08
- FNG VALUE: +38.4
- SPREAD Z-SCORE: -5.78
- NASDAQ100 RET 5D: +0.81
- SP500 RET 5D: +0.44
- NASDAQ100 RET 1D: +0.74
: Very low volatility regime; breadth is strong (100% above SMA50); BTC correlation 0.66; sentiment shows Fear at 38; stablecoin liquidity expanding (0.29% over 7D). : σ24h at 0.80% indicates subdued price fluctuations; vol regime: Very low.
ETF Flows (BTC/ETH)
ETF flow data is provided for BTC and ETH only. This context is external risk indicator and is not a primary signal for LINK. Recent data show a positive flow in BTC ETFs (1D +$629.8M; 5D +$198.4M; 10D +$585.2M) and ETH ETFs (1D +$101.2M; 5D -$20.8M; 10D +$81.6M). Interpreting these flows suggests a general risk-on backdrop for major crypto assets, which can indirectly influence LINK via market-wide liquidity and sentiment, but should not be over-interpreted as aLINK-specific signal.
What to Watch Next
- Watch for a close above 10.8 to validate a potential bullish extension toward 11.0–11.21.
- Monitor a break below 10.4 for confirmation of a downside tilt toward 10.15–9.94.
- Observe shifts in BTC ETF flows as a coarse risk-on/off proxy and their impact on broad crypto liquidity.
- Keep an eye on volume regime and any spike in volatility that could re-center bias.
Hashtags: #LinkAnalysis #CryptoMarkets #TechnicalAnalysis #LINKUSD #ETFFlows #BTC #ETH #CryptoNews #MarketSnapshot #TradingLevels #Liquidity