Market Snapshot
As of 2026-05-13, SOL is trading around the mid-90s with the immediate tape showing a sideways technical setup. The composite view labels the bias as slightly bearish with low certainty (25/100). Market breadth sits around 50% above the 50-day moving average, and BTC correlation stands at 0.73 over 72 hours, indicating moderate macro linkage without decisive trend alignment.
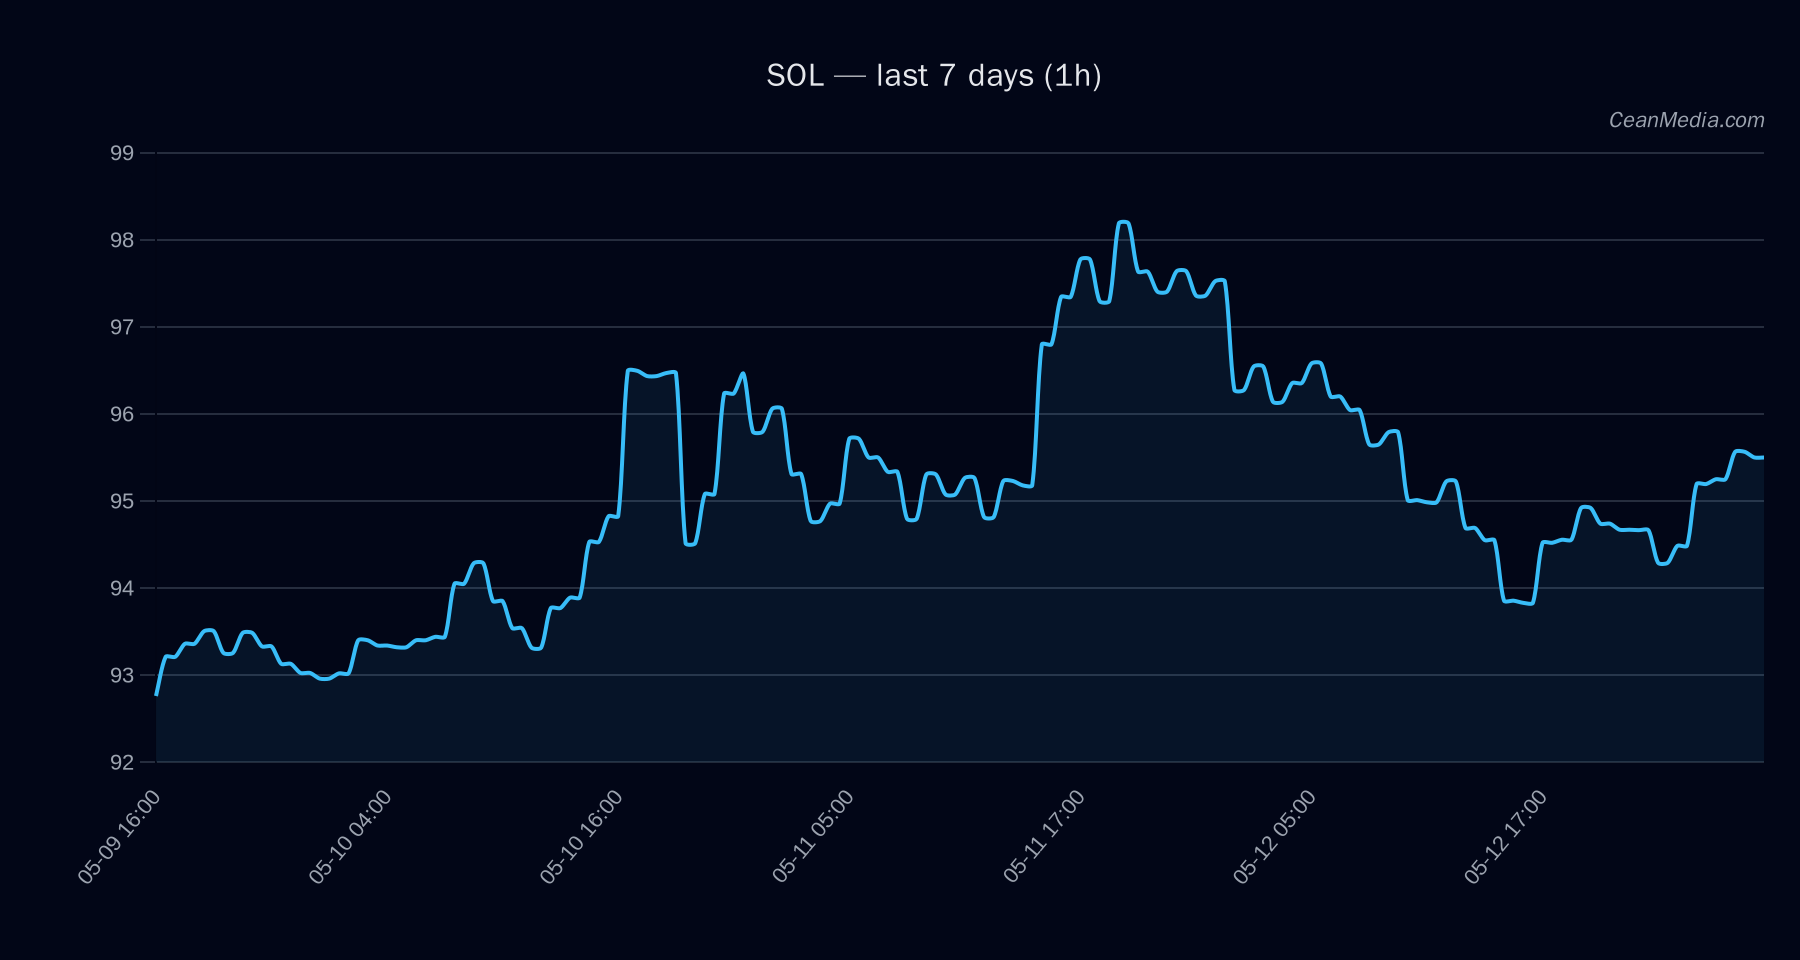
Technical Analysis: SOL
- : Close at 95.28. Forecast range (P50) around 94.13, with a wide band from 91.47 to 104.33 (P20-P80).
- Trend & Indicators: TA trend is sideways. RSI at 51 (neutral). EMA12 < EMA26 and SMA50 > SMA200, suggesting mixed momentum; volatility is very low (σ24h 0.39%).
- Levels:
- Support near 93.4 (major 90.7)
- Resistance near 97.2 (major 95.1)
- Traders’ Triggers:
- Up: 1h close > 97.2 → potential targets 99.13 and 101.07
- Down: 1h close < 93.4 → potential canvases 91.51 and 89.64
- Invalidation: A break outside the established range would warrant re-evaluation of the current sideways bias; triggers provide confirmation levels rather than immediate directional certainty.
Drivers
: Spread-based metrics, Z-scores, and momentum components. Notable contributors include spread z-score and long-positioning dynamics. : Model forecast favors a near-term upside with a 44% probability, but the overall TA signature remains sideways with low volatility. The 7-day drawdown and distance from moving averages point to a cautious stance. : Cross-market risk-off signals are present in broader markets, with fear index around 42. BTC dominance sits around 58.3% with a slight decline over 7 days; overall risk appetite appears mixed.
ETF Flows (BTC/ETH)
ETF flow data provided pertains to BTC and ETH only and should be interpreted as contextual market liquidity signals rather than primary inputs for SOL pricing. The BTC ETF shows positive flow: +$629.8M on a 1-day horizon, with continued positive 5-day and 10-day inflows. ETH ETF also shows positive 1-day flow (+$101.2M) but weaker 5-day flow (-$20.8M) and positive 10-day flow (+$81.6M).
Interpretation: The ETF activity suggests a modest risk-on tilt in BTC and ETH liquidity, which can indirectly support risk assets when correlated. However, ETF data is a supplementary context and is not the primary signal driving SOL’s current technical stance, which remains dominated by price action within the defined support/resistance band.
What to Watch Next
- Watch for a close above 97.2 on an intraday or 1-hour basis to validate the bullish trigger toward the 99.1–101.1 range.
- Monitor a break below 93.4 for potential move toward 91.5–89.6, signaling a shift to a more bearish scenario.
- Keep an eye on volatility regime changes; a rise in σ24h or a breach of vol bands could precede a faster move.
- Assess macro risk-on/off signals alongside BTC/ETH ETF flows as supplementary confirmation but not as the sole driver for SOL positioning.
Hashtags: #SOL #Solana #CryptoTrading #TechnicalAnalysis #ETFFlows #BTC #ETH #MarketSnapshot #PriceAction #Liquidity #MarketCondition