Market Snapshot
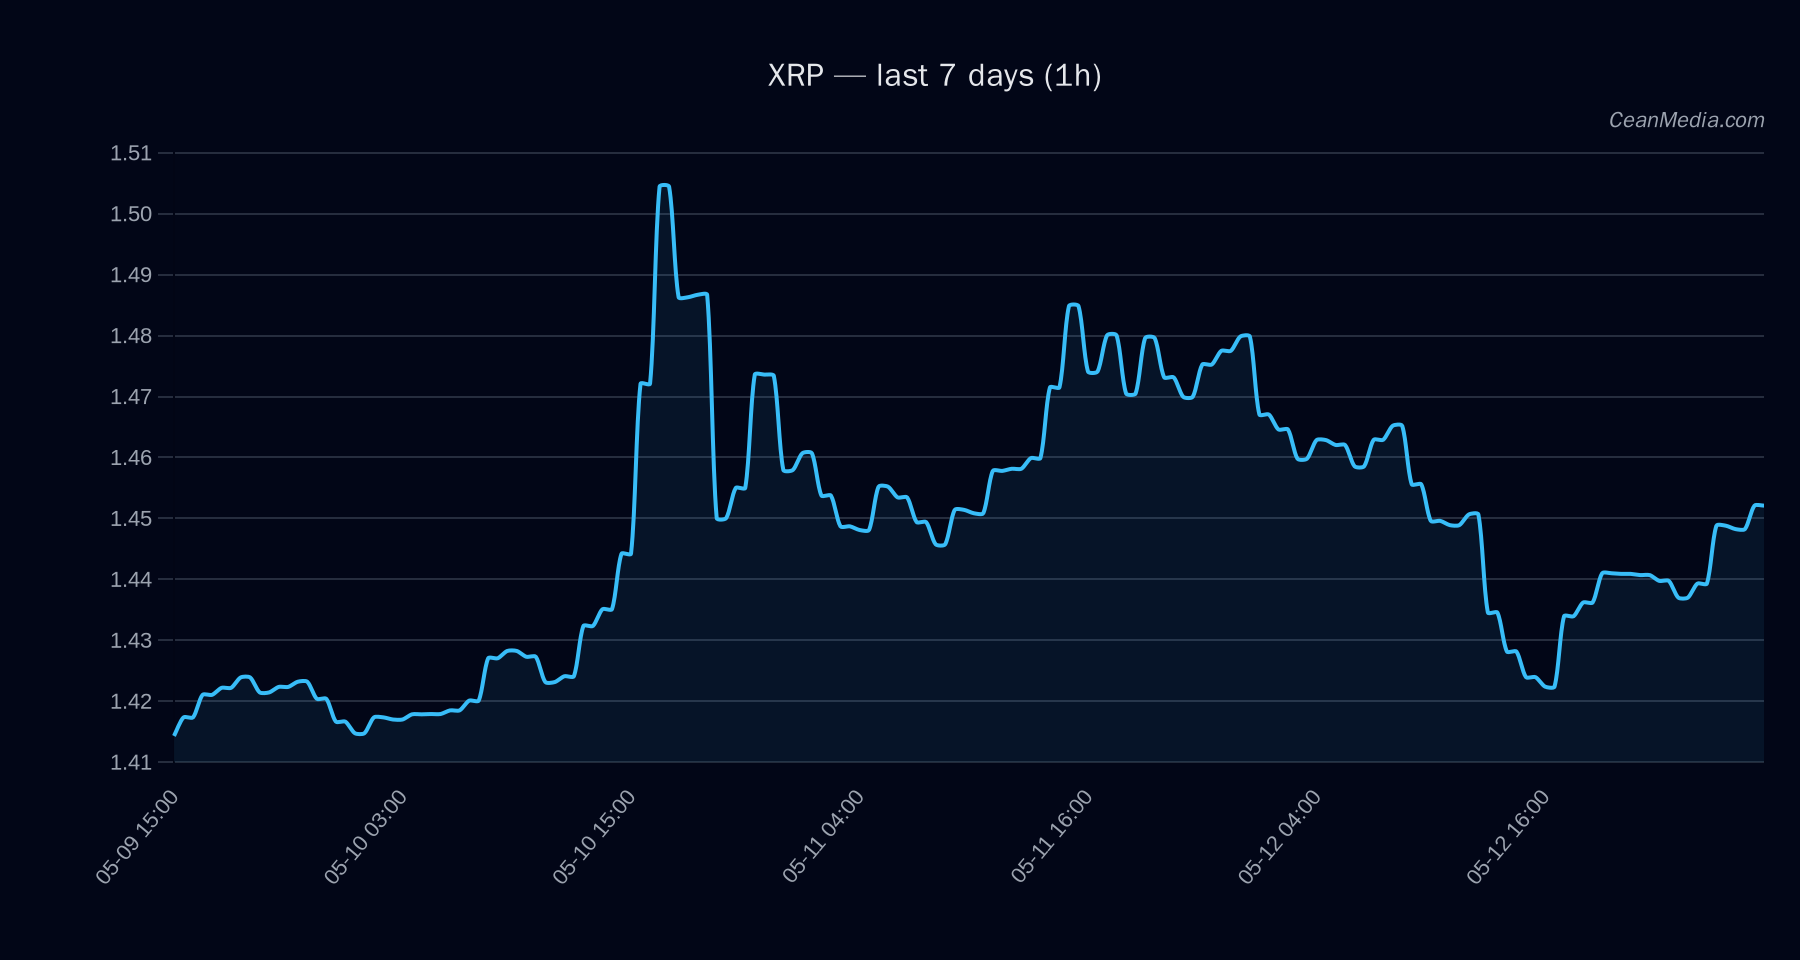
As of 2026-05-13, XRP trades with a mixed/neutral bias and low certainty. The near-term range is defined by support around 1.44 and resistance near 1.50, with breakout considerations driving the forecast range of 1.3877–1.528 (P20–P80).
Technical Analysis: XRP
-0.6, conflicts 0 EMA12 < EMA26, SMA50 > SMA200, σ24h 0.44%, Volatility regime: Very low - Support: near 1.44, major 1.38
- Resistance: near 1.50, major 1.46
- Up: 1h close > 1.5 → potential 1.522–1.5518
- Down: 1h close < 1.44 → potential 1.405–1.3763
Drivers
- Top model drivers indicate mixed momentum with notable contributions from price and macro factors
- Key contributors include: EMA slope, basis z-score, depth z-score, and BTC-related signals
- Market context shows very low volatility, breadth around 50%, BTC dominance around 58.3% (slightly trending down over 7 days)
- Bearish/positive balance implied by the composite driver scores; overall momentum appears limited in the near term
ETF Flows (BTC/ETH)
The ETF flow data provided relates to BTC and ETH only and is presented here as contextual market sentiment. These flows are not primary signals for XRP and should be interpreted as a backdrop for risk appetite and liquidity conditions.
+$629.8M (1D) | +$198.4M (5D) | +$585.2M (10D) +$101.2M (1D) | -$20.8M (5D) | +$81.6M (10D)
Interpretation: The BTC ETF shows continued one-day and multi-day inflows, signaling ongoing demand and risk-on posture among large-cap crypto instruments. ETH ETF data is mixed over longer horizons, suggesting uneven liquidity dynamics. Overall ETF activity implies a backdrop of risk-seeking behavior that may influence correlated assets, though XRP-specific signals remain driven by its own technicals and market structure.
What to Watch Next
- Monitor for a close above 1.50 on any 1-hour bar to validate upside triggers toward 1.522–1.552.
- Watch for a break below 1.44 on a 1-hour bar to open potential moves toward 1.405–1.3763.
- Keep an eye on volatility regime; very low vol can precede faster moves if triggers activate.
- Observe BTC/ETH ETF flow signals as contextual risk-on/off indicators that may influence market sentiment broadly.
Hashtags: #XRP #CryptoAnalysis #TechnicalAnalysis #ETFFlows #MarketSnapshot #Bitcoin #Ethereum #Altcoins #CryptoMarkets #Liquidity #Volatility #MarketSentiment