Market Snapshot
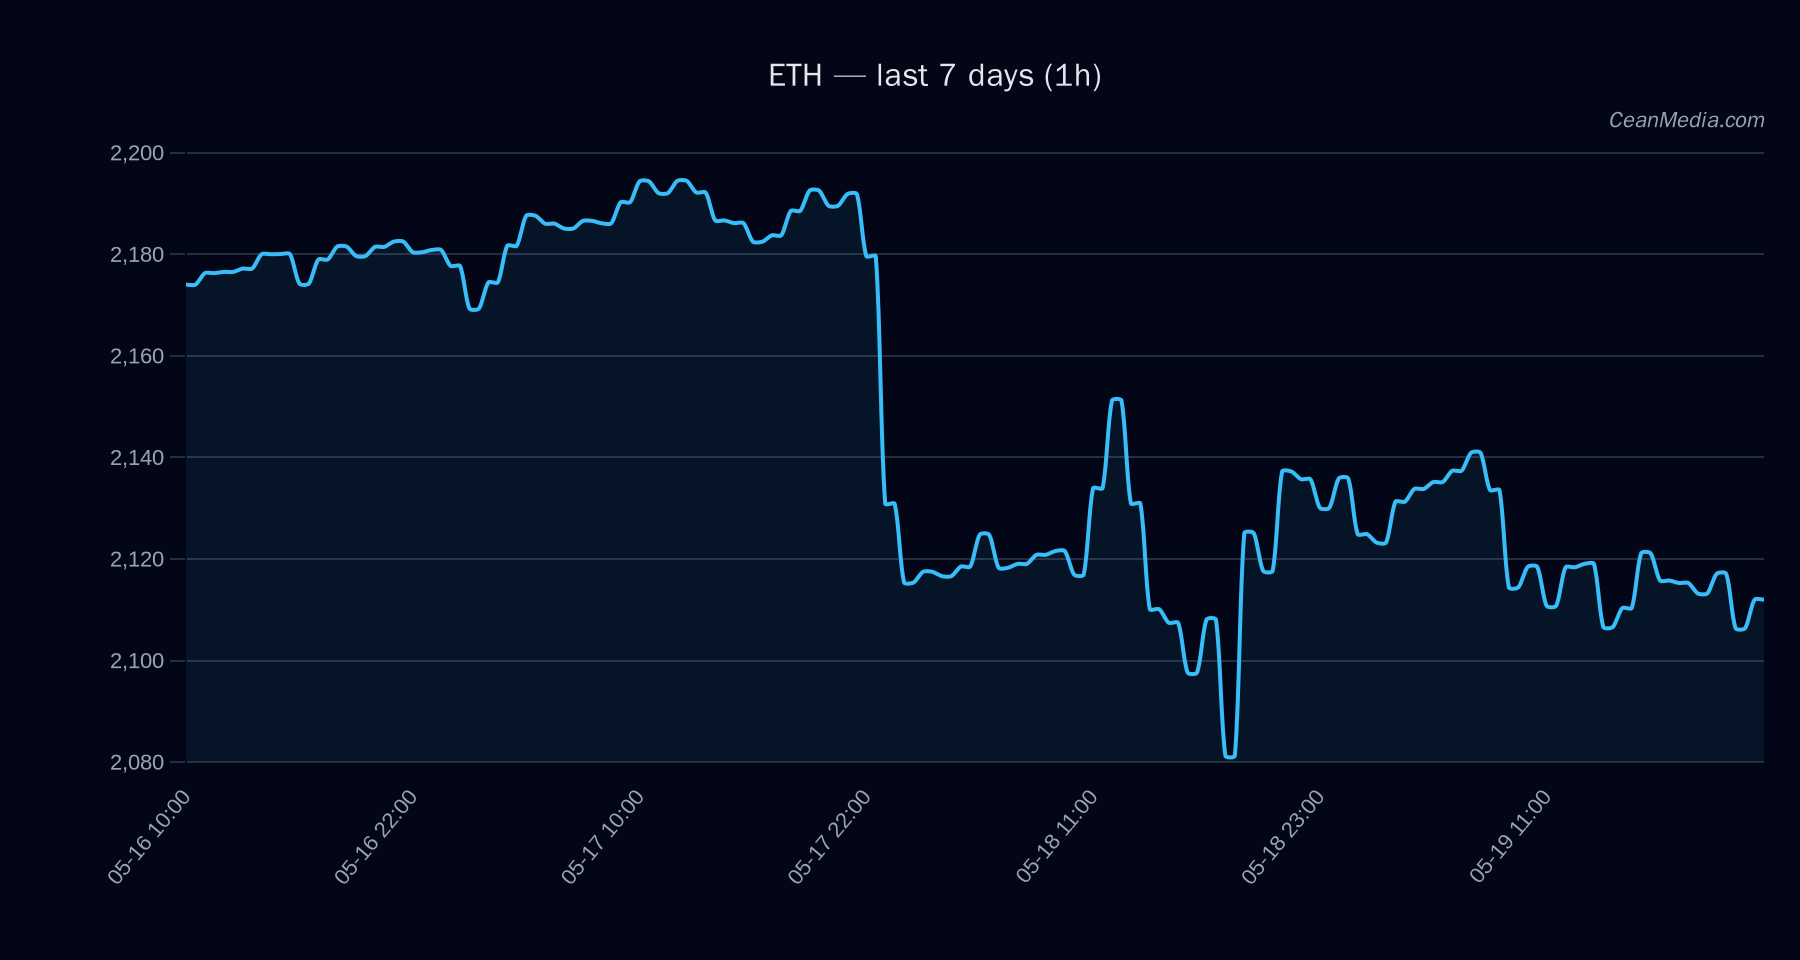
As of the latest data, ETH is trading around the 2,110 level with a bearish tilt in the near term. The observed price range sits between key support near 2,068 and resistance near 2,152. The market context shows very low volatility with subdued breadth, and a BTC correlation of 0.87 over 72 hours.
Technical Analysis: ETH
- Bias: bearish | certainty low (44/100)
- Composite score: -3.1 | conflicts 0
- Price: Close 2,110.43
- Trend: TA trend bearish; RSI 44
- Key indicators: EMA12 < EMA26, SMA50 < SMA200, σ24h 0.34%, Vol regime: Very low
- Forecast: Up 49% probability in the model, but overall forecast reflects a bearish TA stance.
- Support levels: near 2,068 (major 2,136)
- Resistance levels: near 2,152 (major 2,212)
- Traders’ triggers:
- Up: 1h close > 2,152 → 2,195.69 / 2,238.74
- Down: 1h close < 2,068 → 2,026.86 / 1,985.49
- Invalidation: No explicit breakout confirmation beyond current range is indicated; market remains within the defined bands.
Drivers
SPREAD Z-SCORE (-2.02), BTC DOMINANCE (-1.55), FNG DELTA 7D (0.88), GOLD/SILVER RATIO Z-SCORE (0.67), RV 24H (0.47), RV 7D (0.43) - Momentum/volatility: Vol regime: Very low; ATR 6.63, vol unit 8.44; Breadth: 0% above SMA50; BTC correlation: 0.87
- Macro sentiment: Fear reading around 27; ETF flows suggest mixed risk-appetite signals within BTC-ETH context.
ETF Flows (BTC/ETH)
ETF flow data provided here is BTC/ETH specific and should be treated as contextual rather than a primary signal for ETH pricing. BTC ETF flows are substantial and have recently shown positive engagement, while ETH ETF flows are smaller in magnitude. The data indicates:
- BTC ETF: +$629.8M (1D), +$198.4M (5D), +$585.2M (10D)
- ETH ETF: +$101.2M (1D), -$20.8M (5D), +$81.6M (10D)
Interpretation: Elevated BTC ETF activity can reflect a broader risk-on/off tone in the market and may influence spot liquidity and correlation dynamics. ETH ETF data, while positive in the short term, is modest relative to BTC and should not be treated as a standalone ETH signal.
What to Watch Next
- Monitor 1-hour closes around 2,152 for a potential upside continuation trigger.
- Watch for a break below 2,068 as an indicator of renewed downside momentum toward 2,026–1,985.
- Observe BTC dominance and overall BTC price action, given the 0.87 ρ(BTC, 72h) relationship.
- Keep an eye on volatility regime shifts; a move from very low to higher volatility could alter risk premia and timing of breakouts.
Hashtags: #ETH #Ethereum #CryptoMarkets #TechnicalAnalysis #ETFFlows #BTC #PriceAction #MarketSentiment #Volatility #CryptoNews #MarketStrategy