Market Snapshot
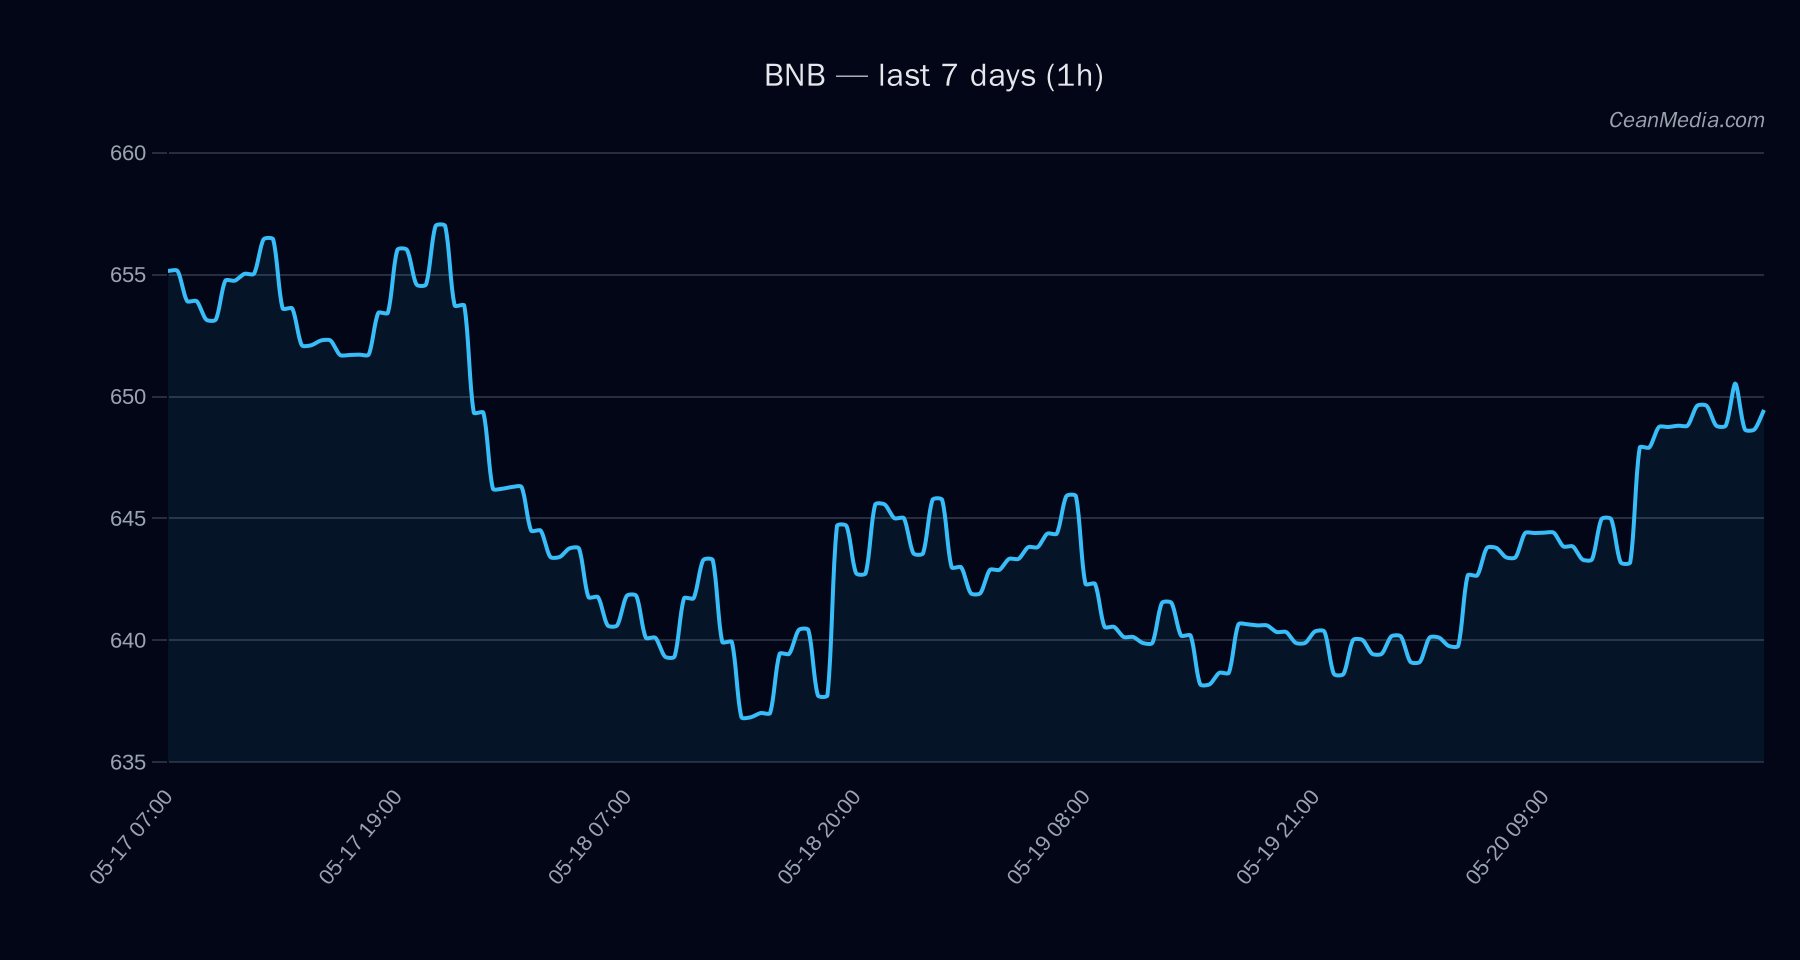
Date: 2026-05-21 | Primary asset: BNB | Price: 650.73
Overall bias is mixed/neutral with low certainty. The composite score is +0.9 with 1 conflict observed. Market data shows very low volatility regime and a breadth of 67% above the 50-day moving average. BTC correlation stands at 0.86 over a 72h horizon, and BTC Dominance is around 58.2% with a slight uptick in the last 7 days.
Technical Analysis: BNB
Trading range bounded by support near 638 and resistance near 664. Major resistance at 674 and major support at 631 are noted. Break above 664 signals potential move to 677.02–690.29; break below 638 opens path to 624.96–612.21. 636.30 – 652.21; median forecast around 642.18; 24h horizon forecast shows a ~51% probability of upside movement. Up: 1h close > 664 → 677.02 / 690.29; Down: 1h close < 638 → 624.96 / 612.21. Trend strength modest (0.76); EMA12 > EMA26 and SMA50 < SMA200 supportive of a range-bound setup rather than a firm breakout.
Drivers
Return 24h modest at ~0.01; EMA slope positive; BTC 24h return ~0.93%; BTC vol regime present but not extreme; Funding and Basis z-scores show mixed pressure; Order-book imbalance (EMA5) modest; overall trend strength indicates cautious upside potential. Very low vol regime; breadth 67% above SMA50 indicates broad participation among risk assets but not extreme, aligning with a cautious stance for BNB. Cross-market risk assets supportive; sentiment shows Fear at 29 on the Fear & Greed index; BTC dominance at 58.23% with minimal week-over-week change.
ETF Flows (BTC/ETH)
Context note: ETF flow data presented here reflects BTC/ETH ETFs and is not a primary signal for BNB. The data provides market-wide risk appetite context that can influence altcoins such as BNB.
1D +$629.8M; 5D +$198.4M; 10D +$585.2M. Indicates a positive near-term flow trend in BTC-focused instruments. 1D +$101.2M; 5D -$20.8M; 10D +$81.6M. Moderate net inflows with a softer 5-day reading, suggesting mixed performance in ETH-linked products.
What to Watch Next
- Monitor price action around the 664 resistance and 638 support; a close above 664 strengthens the case for a move toward 677–690.
- Watch for a 1h close below 638 as an invalidation signal increasing downside risk toward 624.96–612.21.
- Keep an eye on volatility regime; very low volatility can precede abrupt moves if a trigger hits.
- Consider macro risk-on signals; BTC/ETH ETF flows suggest constructive risk appetite, but ETF data should not be used as a primary driver for BNB decisions.
Hashtags: #BNB #CryptoTrading #TechnicalAnalysis #Altcoins #MarketSnapshot #ETFFlows #BTC #ETH #RiskOn #MarketContext #TradingRange #PriceAction