Market Snapshot
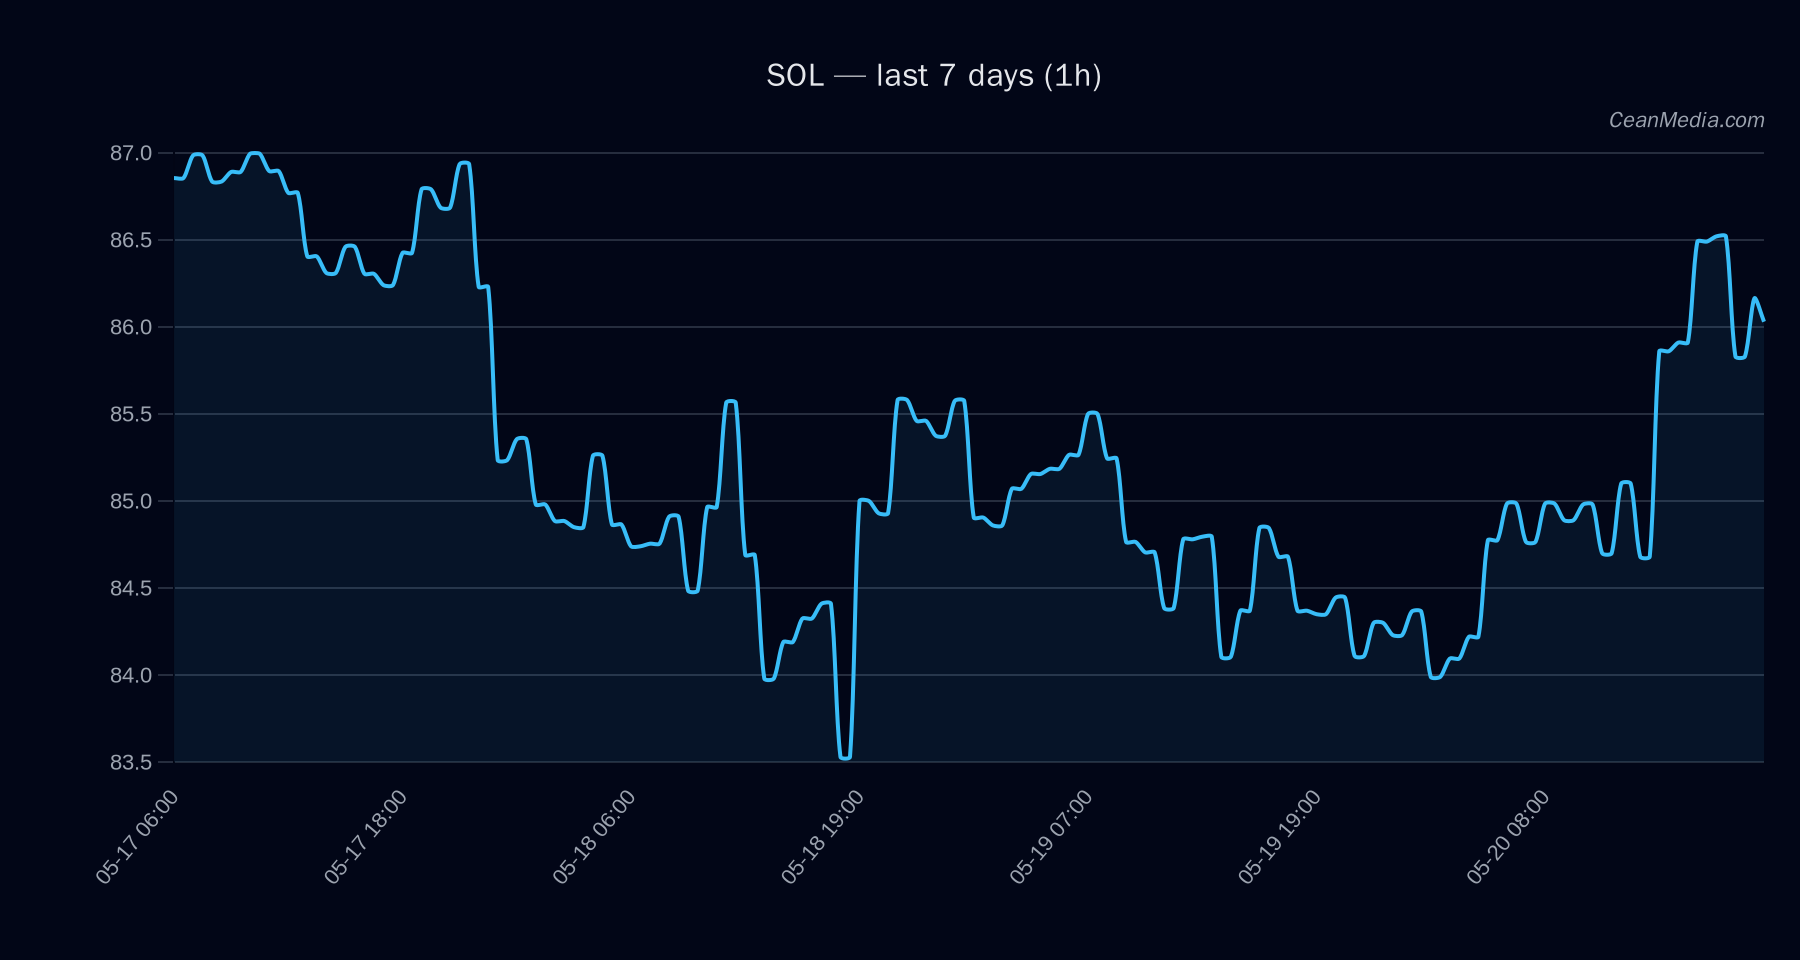
Solana (SOL) sits within a defined range with a close of 86.03 as of 2026-05-20. The market context shows very low volatility and a breadth of 67% above the 50-day moving average, with BTC dominance at 58.2% and a 24-hour Bitcoin-based momentum signal reflected in the top drivers. Overall sentiment scoring indicates a slightly bullish tilt with low certainty.
Key metrics at a glance include a price near the middle of the trading range, intraday bias leaning slightly bullish, and a forecast range that suggests modest upside potential over the next 24 hours.
Technical Analysis: SOL
- Bias: Slightly bullish
- Certainty: Low (21/100)
- Composite score: +1.5
- Current price: 86.03
- Trend: Sideways (RSI 59; EMA12>EMA26; SMA50
- Volatility regime: Very low (σ24h 0.45%, ATR 0.3375)
- Forecast (24h): Up 46%, Sideways 15%, Down 39% (Model: up)
- Forecast range (P50): 85.28;
P20-P80: 81.60 – 87.77
- Support / Resistance: Support near 84.3 (major 84.7); Resistance near 87.8 (major 91.1)
- Triggers: Up: 1h close > 87.8 → 89.51–91.26; Down: 1h close < 84.3 → 82.62–80.94
- Invalidation: Breakhold outside the defined levels would require re-evaluation of the setup, with attention to volatility regime and breadth shifts.
Drivers
BTC Dominance (-1.05 contribution, value 1.87); Stable MCAP Log1p (+0.65, 0.96); BTC RV 24H (-0.55, -1.37); Russell 2000 RET 5D (+0.55, -0.56); LS Top Z-Score (-0.54, 1.23); Depth Z-Score (-0.46, -1.57) Breadth 67% above SMA50; BTC/ETH implied activity and BTC dominance dynamics present, with a very low vol regime.
ETF Flows (BTC/ETH)
ETF flow data is provided for BTC and ETH only and should be regarded as contextual sentiment rather than a primary SOL signal. Current indicators show BTC ETFs positive over 1D, 5D, and 10D horizons (+$629.8M, +$198.4M, +$585.2M respectively), and ETH ETFs positive on 1D (+$101.2M) but slightly negative on 5D (-$20.8M) and positive on 10D (+$81.6M).
Interpretation: net inflows into BTC/ETH ETFs suggest a risk-on tilt for broader crypto markets, which can support altcoins like SOL during periods of constructive risk appetite. However, the SOL-specific signal remains driven by its own technicals and on-chain dynamics; ETF data should be considered as supplementary context rather than a primary driver for SOL positioning.
What to Watch Next
- Watch for a close above 87.8 to validate upside target toward 89.51–91.26.
- Monitor a break below 84.3 to gauge potential downside toward 82.62–80.94.
- Assess changes in BTC dominance and BTC/ETH ETF inflows as a market-wide sentiment proxy.
- Keep an eye on volatility regime shifts and breadth readings, which can precede breakout or breakdown events.
Hashtags: #Solana #SOL #CryptoTechnicalAnalysis #ETF Flows #BTC #ETH #MarketSnapshot #TradingRange #CryptoOutlook