Market Snapshot
As of 2026-05-22, XRP trades with a mixed to bearish short-term bias. The composite score is negative (-2.7) with low conviction (14/100). Priceaction sits within a narrow range, highlighting low volatility and limited directional commitment. The BTC market context shows a strong positive ETF flow signal for BTC and a supportive, albeit separate, macro environment for risk assets, which provides general liquidity but should not be interpreted as XRP-specific guidance.
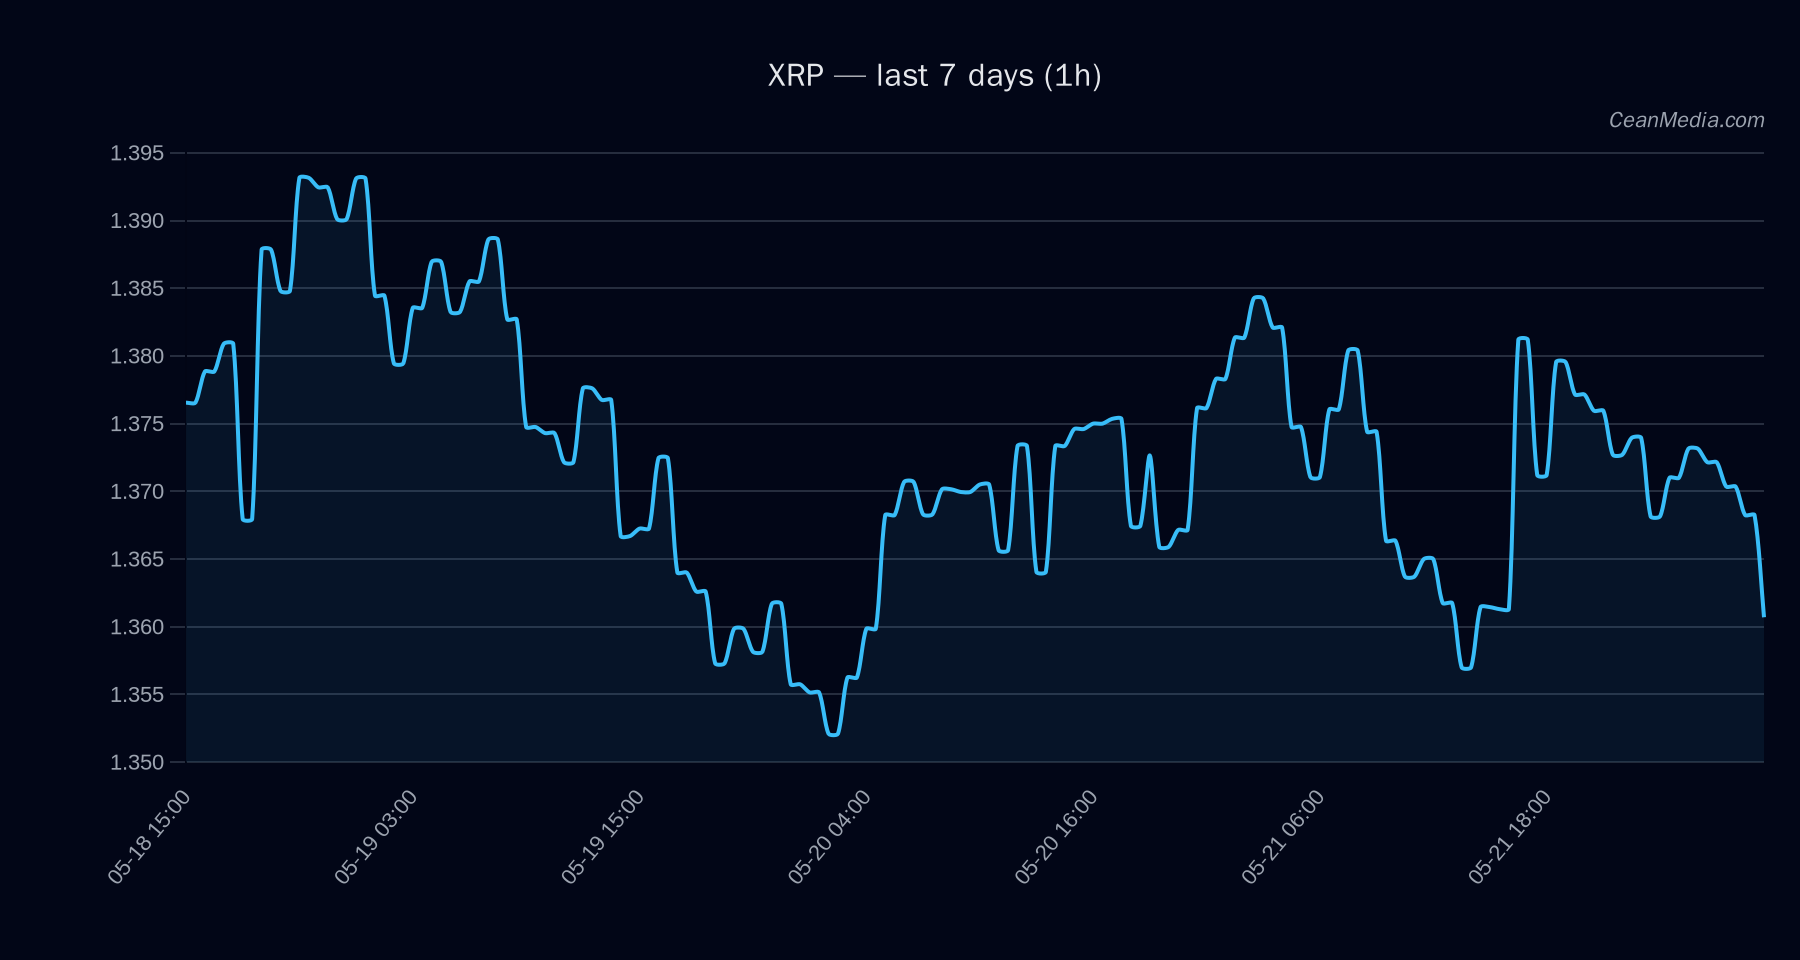
Technical Analysis: XRP
Current price: 1.3579
- Bias: mixed to bearish pressure; certainty low.
- Technical trend: bearish (EMA12 < EMA26; SMA50 < SMA200; RSI 39; volatility regime: very low; 24h sigma 0.46%).
- RSI: 39 (neutral within a bearish context).
- Key levels: Support near 1.34; major support/1.38 resistance; major resistance near 1.46. Forecast range: P50 around 1.3698; P20-P80 between 1.3021 and 1.4335.
Forecast and triggers:
- Up trigger: close > 1.38 in 1h -> potential moves to 1.4128 then 1.4405.
- Down/invalidation trigger: close < 1.34 in 1h -> potential moves to 1.3041 then 1.2775.
Invalidation/Directionality: Evidence is not aligned; model notes a mixed. Treat direction as low-conviction until a clear trigger confirms breakout or breakdown.
Drivers
- Spread Z-Score: -2.06 contribution; value 3.12
- Spread BP: 1.2 contribution; value 1.07
- RV 7D: 0.97 contribution; value -1.01
- Gold/Silver returns and other macro factors provide mixed signals.
- Order-book imbalance (EMA5): 0.01
Volatility regime is very low; breadth slightly constructive (≈50% above SMA50). BTC dominance stands at ~58.1% with a small downward delta over 7 days, indicating a cautious risk sentiment environment.
Momentum/Volatility: The momentum indicators point to a lack of strong directional momentum, with trend strength around mid-range and low intraday volatility.
ETF Flows (BTC/ETH)
Contextual note: ETF flow data provided here is specific to BTC and ETH and is not a direct signal for XRP. However, substantial BTC/ETH ETF inflows contribute to overall market liquidity and risk-appetite, which can influence XRP indirectly through correlated market moves.
1D +$629.8M; 5D +$198.4M; 10D +$585.2M 1D +$101.2M; 5D -$20.8M; 10D +$81.6M
The net effect of BTC/ETH ETF flows suggests positioning for risk-on in the broader crypto complex, which may support liquidity and risk appetite. This is contextual data and should not be treated as XRP-specific buy/sell signals.
What to Watch Next
- Watch for a close above 1.38 on a shorter time frame to validate a potential upside path toward 1.4128 and 1.4405.
- Monitor a break below 1.34 on a 1h or higher timeframe to assess downside risk toward 1.3041 and 1.2775.
- Observe any shift in ETF flows indirectly influencing risk-on sentiment in broader crypto markets, particularly BTC/ETH, to gauge potential cross-asset spillovers.
- Keep an eye on implied volatility and order-book dynamics (EMA5) for signs of increasing momentum or crowding in one direction.
Hashtags: #XRP #CryptoAnalysis #TechnicalAnalysis #ETFFlows #BTC #ETH #MarketSnapshot #CryptoMarkets #RiskOn #PriceAction #Liquidity #Altcoins