Market Snapshot
As of 2026-05-24, XRP trades around the 1.36 area with a mixed to neutral bias and low certainty. Market breadth remains robust (100% above SMA50), BTC correlation strong (0.91 over 72 hours), and the overall volatility regime is very low. Ether and BTC ETF flows show notable inflows into BTC, with a cautious backdrop in risk assets.
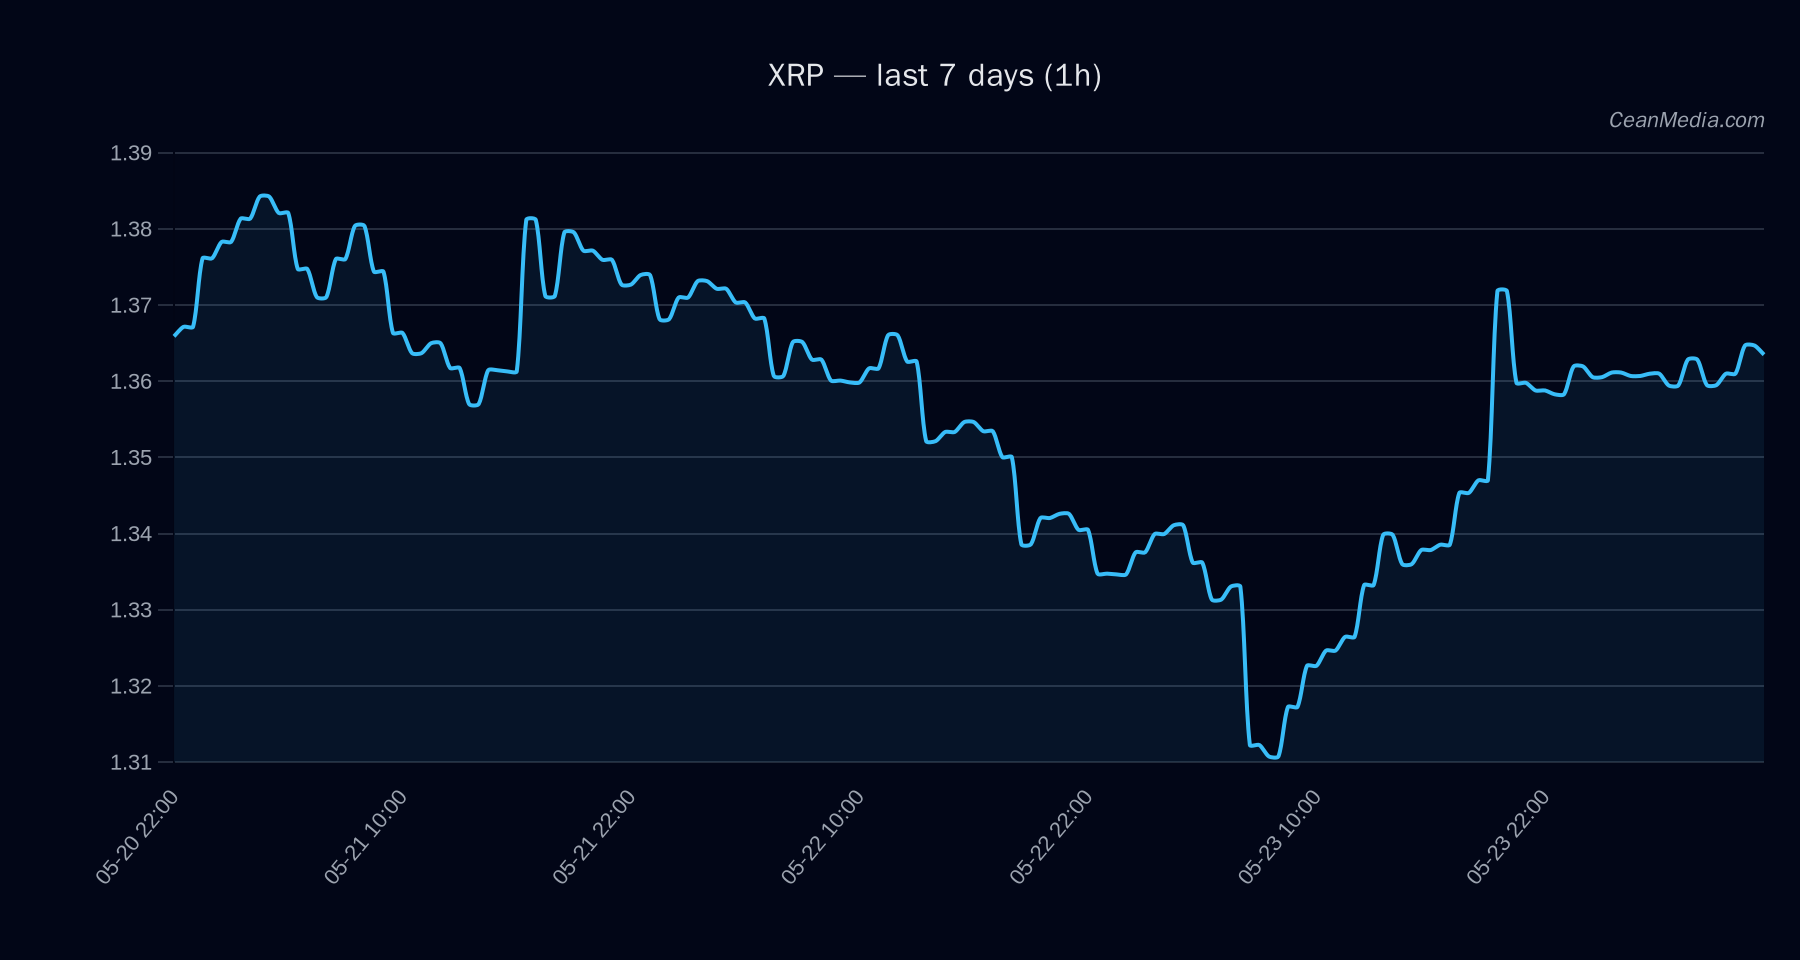
Technical Analysis: XRP
Price: Close 1.3638. Forecast range (P50): 1.3577; 20th–80th percentile: 1.3142–1.4263.
Bias and Trend: The composite view is mixed/neutral with a low certainty score (5/100). TA trend is sideways with RSI at 61. The indicators show EMA12 > EMA26, SMA50 < SMA200, and a very low volatility regime (σ24h 0.46%).
Key Levels:
- Support near 1.34; major support at 1.36
- Resistance near 1.40; major resistance at 1.46
Triggers:
- Up: 1h close > 1.40 targets 1.4189 and 1.4467
- Down: 1h close < 1.34 targets 1.3098 and 1.2831
Invalidation: No explicit invalidation level provided beyond the downside and upside triggers; the forecast remains conditional on price interaction with the stated levels.
Drivers (TA inputs):
- EMA12 > EMA26, SMA50 < SMA200
- RSI 61 indicates mid-range momentum
- Volatility regime described as Very Low
Drivers
include liquidity and order-book metrics: EMA12 slope, and various Z-scores (Funding, Basis) influencing short-term bias. : RV 7D modest positive contribution; Vol Regime and Vol of Vol are subdued, indicating limited near-term price swing. : Cross-market risk assets softening; crypto sentiment remains in Fear (F&G 25). BTC dominance around 58.1% with a slight decline over 7 days.
ETF Flows (BTC/ETH)
Intra-crypto ETF flows show substantial inflows into BTC ETFs on both 1D and longer horizons, with positive 5D and 10D figures as listed. ETH ETF data are positive for 1D but show mixed 5D/10D signals. It is important to stress that ETF flow data are contextual inputs and not primary signals for XRP, which trades independently from BTC/ETH ETF movements.
- BTC ETF: 1D +$629.8M | 5D +$198.4M | 10D +$585.2M
- ETH ETF: 1D +$101.2M | 5D -$20.8M | 10D +$81.6M
Interpretation: The BTC ETF inflows suggest a supportive risk-on backdrop for correlated assets; however, XRP-specific trading signals should be interpreted in the context of its own technicals and liquidity dynamics. ETF data are not a stand-alone XRP signal.
What to Watch Next
- Monitor 1h close around 1.40 to assess potential breakout to 1.4189–1.4467.
- Watch for a break below 1.34 to confirm downside targets near 1.3098 and 1.2831.
- Assess changes in liquidity conditions and order-book imbalances around key levels (1.34, 1.40).
- Track BTC ETF inflows and risk-on/off signals as contextual backdrop, but rely primarily on XRP-specific levels for trading decisions.
Hashtags: #XRP #CryptoAnalysis #TechnicalAnalysis #ETFFlows #Bitcoin #Altcoins #MarketSnapshot #Liquidity #PriceLevels #TradingStrategy #RiskManagement #CryptoNews