Market Snapshot
As of 2026-05-27, the primary asset analyzed is BNB with a price near 648.82. The overall bias is mixed to bearish with low certainty (26/100). The composite score is -2.7, indicating conflict among indicators. Market context shows very low volatility and narrowly ranged activity, with cross-market softness in risk assets and contracting stablecoin liquidity. ETF flow data provided here pertains to BTC and ETH and should be treated as contextual rather than a primary signal for BNB moves.
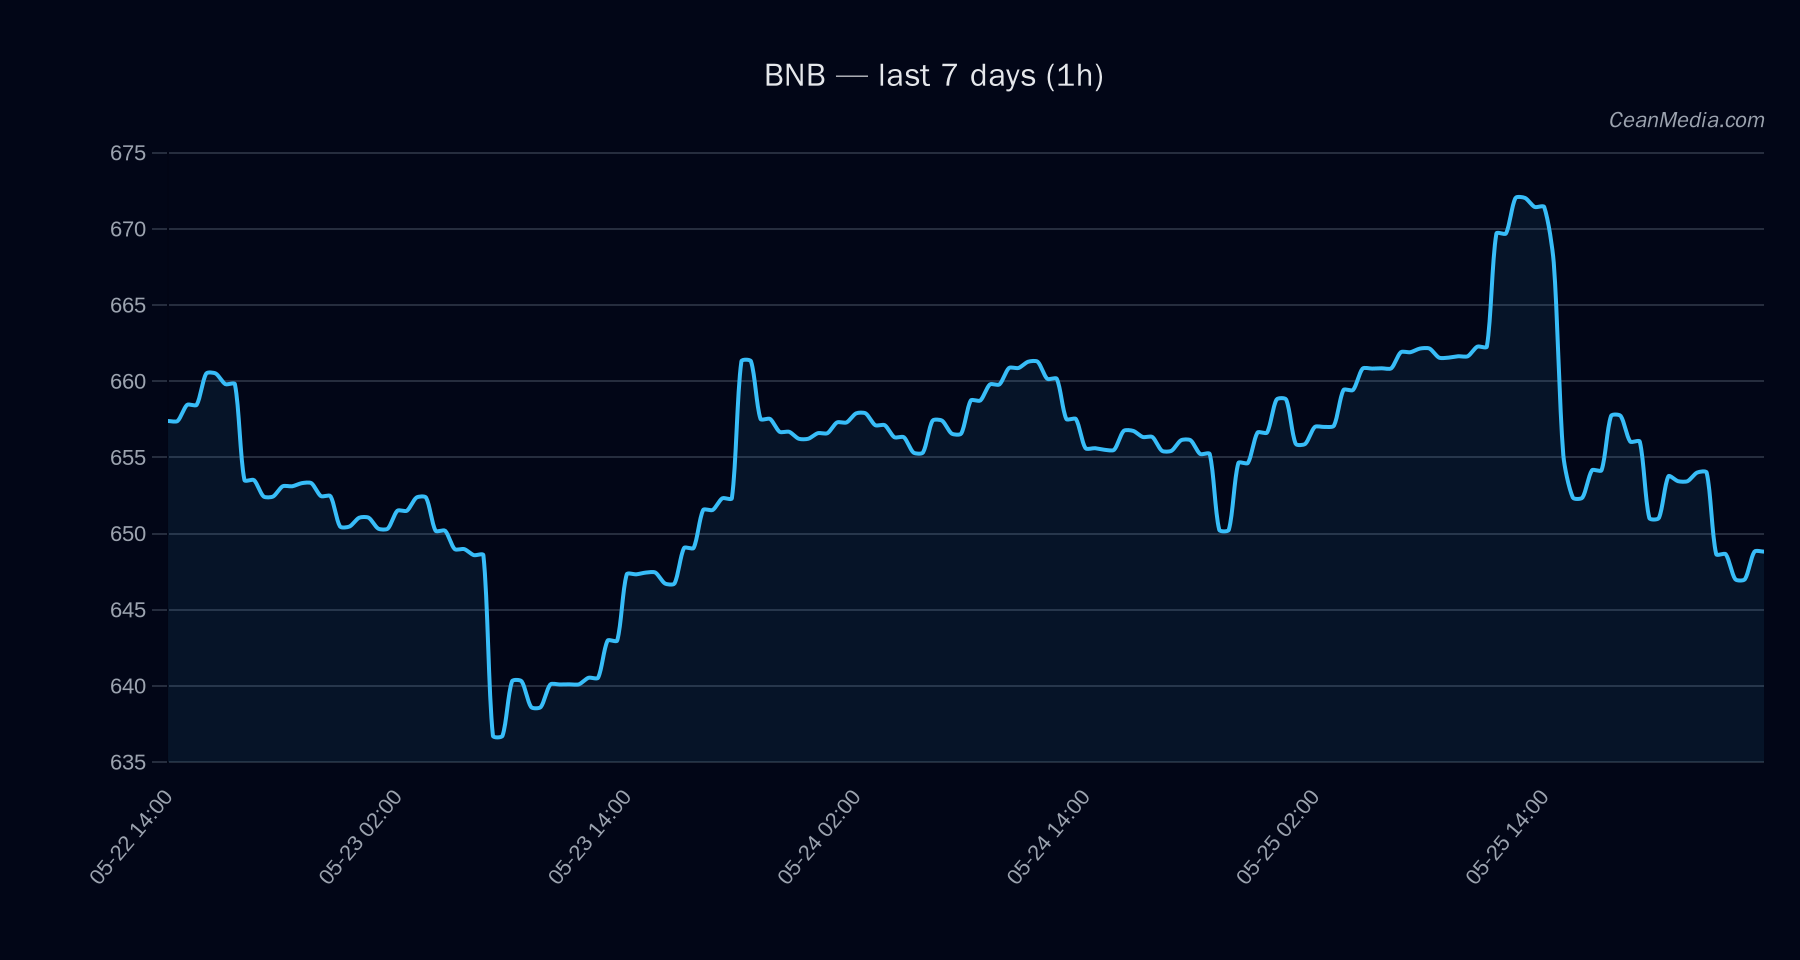
Technical Analysis: BNB
- Price action and range: Current close 648.82, trading within a defined range with support near 636 and major support near 643; resistance near 662 and major resistance near 674.
- Tendency and indicators: TA trend is sideways. RSI at 39 suggests ongoing neutral to bearish momentum. EMA12 < EMA26 and SMA50 > SMA200 indicate a bearish/slowdown tilt in price action, with very low 24h volatility (σ24h 0.56%). Volatility regime described as Very Low.
- Forecast and probability: Model forecast leans down (55%); probabilities: up 34%, sideways 11%, down 55%. P50 target around 645.13 with a 20th-80th percentile range of 623.13 to 671.52.
- Key triggers: Up trigger: Close above 662 to target 675.03–688.27. Down trigger: Close below 636 to target 623.13–610.41.
- Invalidation/uncertainty: Evidence is not fully aligned; the forecast notes mixed signals and a low conviction environment. Treat direction as low-conviction pending trigger confirmations.
Drivers
Spread BP contribution (-1.33), FNG Z-Score (-0.48), NASDAQ100 5D return (0.5), S&P 500 5D return (0.38), Stablecoin market cap log1p (0.74), and BTC dominance (1.12) with mixed signs across factors. BTC dominance currently ~57.8%. Market breadth is weak (0% above SMA50). BTC/altcoin relationships show cross-market softness in risk assets (−1.22% on cross-market measure) and extreme fear sentiment (F&G around 22). Overall risk-off backdrop evident in stablecoin liquidity contraction over 7 days and BTC dominance dynamics, contributing to cautious appetite for downside risk in non-BTC assets.
ETF Flows (BTC/ETH)
ETF flow data provided is limited to BTC and ETH, and is contextual rather than a primary signal for BNB. Interpreting these flows can offer insight into risk-on/risk-off environment and systemic liquidity moves influencing broader crypto markets.
+$629.8M 1D, +$198.4M 5D, +$585.2M 10D. +$101.2M 1D, -$20.8M 5D, +$81.6M 10D.
Interpretation: The net positive ETF flows in BTC/ETH over short to medium horizons suggest ongoing risk-on demand for leading-market assets, which can support broader liquidity and sentiment. However, these signals are not specific to BNB and should be considered as contextual backdrop rather than a direct driver of BNB price action.
What to Watch Next
- Monitor for a close above 662 to validate a bullish breakout potential toward 675.03–688.27 or higher resistance.
- Watch for a break below 636 to confirm downside risk toward 623.13–610.41 with potential follow-through if momentum deteriorates.
- Observe shifts in BTC/ETH ETF flows and risk-on/risk-off sentiment as a broader backdrop for alts, including BNB.
- Keep an eye on RSI trends (currently 39) for signs of momentum reversion or continued consolidation.
Hashtags: #BNBAnalysis #CryptoTechnicals #MarketSnapshot #ETFFlows #BTCETF #ETHETF #CryptoMarkets #RiskOnOff #Altcoins #TradingStrategy #PriceAction #Liquidity